

HOT TOPICS LIST
- MACD
- Fibonacci
- RSI
- Gann
- ADXR
- Stochastics
- Volume
- Triangles
- Futures
- Cycles
- Volatility
- ZIGZAG
- MESA
- Retracement
- Aroon
INDICATORS LIST
LIST OF TOPICS
PRINT THIS ARTICLE
by Alan R. Northam
Statistical analysis shows the Dow Jones Industrial Average is nearing the end of its long-term upward trend.
Position: N/A
Alan R. Northam
Alan Northam lives in the Dallas, Texas area and as an electronic engineer gave him an analytical mind from which he has developed a thorough knowledge of stock market technical analysis. His abilities to analyze the future direction of the stock market has allowed him to successfully trade of his own portfolio over the last 30 years. Mr. Northam is now retired and trading the stock market full time. You can reach him at inquiry@tradersclassroom.com or by visiting his website at http://www.tradersclassroom.com. You can also follow him on Twitter @TradersClassrm.
PRINT THIS ARTICLE
STATISTICS
Trend Ending For The Dow Jones Industrials?
11/06/13 05:16:26 PMby Alan R. Northam
Statistical analysis shows the Dow Jones Industrial Average is nearing the end of its long-term upward trend.
Position: N/A
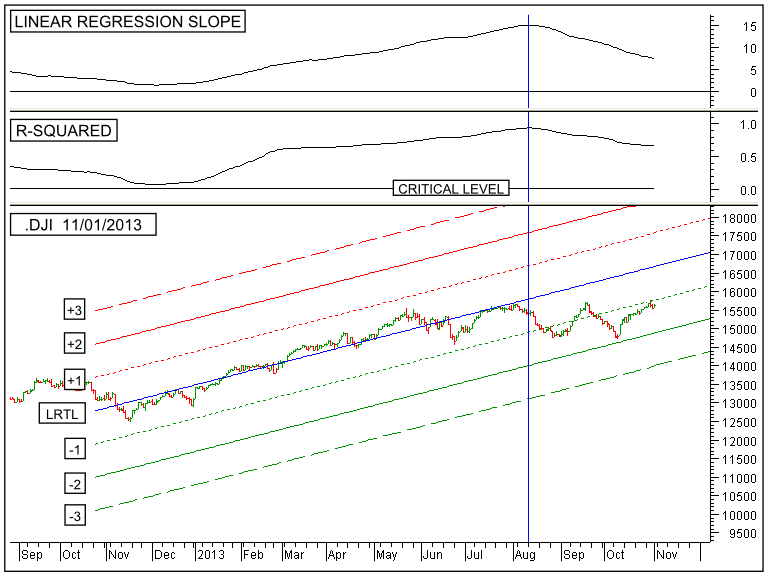
| The bottom panel of Figure 1 shows the daily price bars of the Dow Jones Industrial Average (.DJI). This figure also shows the 200-day linear regression trend line (upward sloping blue line) along with the upper 1 sigma channel line (red dotted line), the upper 2 sigma channel line (solid red line), the upper 3 sigma channel line (dashed red line), the lower 1 sigma channel (green dotted line), the lower 2 sigma channel line (solid green line), and the lower 3 sigma channel line (dashed green line). The red channel lines represent resistance lines and the green channel lines represent support. |
|
| Figure 1. Daily chart of the Dow Jones Industrials Average. |
| Graphic provided by: MetaStock. |
| |
| The linear regression trend line and its associated upper and lower sigma channel lines are drawn on the chart to the left of the vertical blue line, from early August 2013 to mid-late October 2012 — a period of 200 trading sessions. To the right of the vertical blue line, the linear regression trend line and its associated channel lines have been extended to show the projected future path of the upward trend. The vertical blue line was first placed on the chart in mid-August 2013 and the upward sloping lines to the right of this line represented the trend, resistance, and support lines for future prices. Since that time the daily movement of price has partially filled the chart to the right of the vertical blue line. Notice that from August 2013 backwards to late October 2012, the closing price of the Dow Jones Industrial Average traded between the upper and lower 1 sigma channel lines indicating a strong long-term upward trend (from statistics the closer the data is to the linear regression trend line the stronger the trend). Also notice that from August 2013 to November 2013 the closing price has fallen away from the blue upward sloping linear regression trend line and is now trading between the -1 sigma channel line and -2 sigma channel line. This is a sign of increased volatility, which normally occurs near the end of a trend. This is not a rule as the trend can and sometimes does continue for quite some time, but most often it is a sign that the end of a trend is near. |
| In the top panel of Figure 1 is plotted the linear regression slope indicator. When this indicator is above its zero line and moving upward, it indicates an accelerating upward trend. When this indicator is above its zero line and moving in a downward direction, as it is now, it indicates that the trend is in an upward direction but price has entered into a deceleration stage. What is important to remember about the price deceleration stage is that it normally occurs near the end of a trend. However, the exception is that on occasion price can re-accelerate and the current trend can continue on for quite some time. The upward trend is actually reversed when the linear regression slope indicator moves below its zero line. |
| The next lower panel shows the R-squared indicator and is a measure of confidence of the trend as well as a measure of its strength. Whenever this indicator is above its critical level, as it is now, it indicates there is a 95% statistical confidence level that the trend will continue, as it has done since its crossing in February 2012. This indicator is also a measure of the trend's strength. The strength of the trend is determined by measuring what percentage of price movement over the last 200 trading sessions has been considered to be trending or adding to the upward price movement. Currently this indicator is reading 0.67 meaning that 67% of the price movement, over the last 200 trading sessions, has been contributing to the price trend. The higher the percentage, the stronger the trend. In August 2013, 94% of the daily price movement was contributing to the trend. By inference it also says that 33% of the price movement was not contributing to the trend or simply random price movement. Notice that from mid-August 2013 onward the trend has been weakening as more and more of the daily price movement is becoming random. |
| In conclusion, this statistical analysis shows that the long-term trend of the Dow Jones Industrial Average remains in an upward direction. However, it is also shown that from August onward price has been in a stage of deceleration which normally occurs near the end of a trend. This analysis also shows that the current trend has been weakening in that more and more of the daily price movement is becoming random and not contributing to the upward trend. Thus this analysis suggests that the long-term upward trend of the Dow Jones Industrial Average is in its final upward stage. |
Alan Northam lives in the Dallas, Texas area and as an electronic engineer gave him an analytical mind from which he has developed a thorough knowledge of stock market technical analysis. His abilities to analyze the future direction of the stock market has allowed him to successfully trade of his own portfolio over the last 30 years. Mr. Northam is now retired and trading the stock market full time. You can reach him at inquiry@tradersclassroom.com or by visiting his website at http://www.tradersclassroom.com. You can also follow him on Twitter @TradersClassrm.
| Garland, Tx | |
| Website: | www.tradersclassroom.com |
| E-mail address: | inquiry@tradersclassroom.com |
Click here for more information about our publications!
Comments

Request Information From Our Sponsors
- StockCharts.com, Inc.
- Candle Patterns
- Candlestick Charting Explained
- Intermarket Technical Analysis
- John Murphy on Chart Analysis
- John Murphy's Chart Pattern Recognition
- John Murphy's Market Message
- MurphyExplainsMarketAnalysis-Intermarket Analysis
- MurphyExplainsMarketAnalysis-Visual Analysis
- StockCharts.com
- Technical Analysis of the Financial Markets
- The Visual Investor
- VectorVest, Inc.
- Executive Premier Workshop
- One-Day Options Course
- OptionsPro
- Retirement Income Workshop
- Sure-Fire Trading Systems (VectorVest, Inc.)
- Trading as a Business Workshop
- VectorVest 7 EOD
- VectorVest 7 RealTime/IntraDay
- VectorVest AutoTester
- VectorVest Educational Services
- VectorVest OnLine
- VectorVest Options Analyzer
- VectorVest ProGraphics v6.0
- VectorVest ProTrader 7
- VectorVest RealTime Derby Tool
- VectorVest Simulator
- VectorVest Variator
- VectorVest Watchdog