

HOT TOPICS LIST
- MACD
- Fibonacci
- RSI
- Gann
- ADXR
- Stochastics
- Volume
- Triangles
- Futures
- Cycles
- Volatility
- ZIGZAG
- MESA
- Retracement
- Aroon
INDICATORS LIST
LIST OF TOPICS
PRINT THIS ARTICLE
by Matt Blackman
As the second week of May began, a number of patterns became increasingly evident that should give the bulls pause and cause the bears to lick their chops.
Position: N/A
Matt Blackman
Matt Blackman is a full-time technical and financial writer and trader. He produces corporate and financial newsletters, and assists clients in getting published in the mainstream media. He is the host of TradeSystemGuru.com. Matt has earned the Chartered Market Technician (CMT) designation. Find out what stocks and futures Matt is watching on Twitter at www.twitter.com/RatioTrade
PRINT THIS ARTICLE
HEAD & SHOULDERS
Market Watch: Beware the Hydra
05/14/14 04:28:41 PMby Matt Blackman
As the second week of May began, a number of patterns became increasingly evident that should give the bulls pause and cause the bears to lick their chops.
Position: N/A
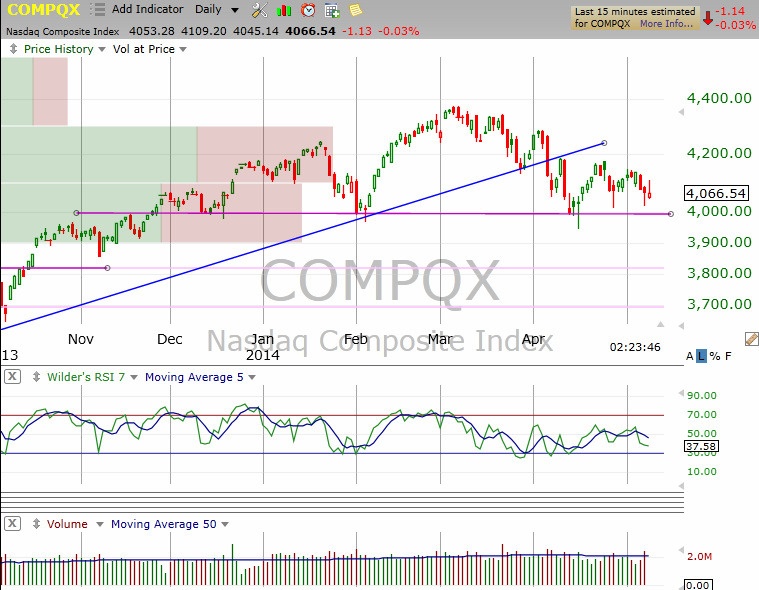
| The Hydra was a Greek mythological creature with nine heads that terrorized anyone who came in contact with it. It's a fitting analogy for what we were seeing in markets in the second week of May. As the charts in this article demonstrate, there are a number of ominous "heads" appearing on some major indexes and prior market leading stocks that should sober up even the most strident bull. After breaking uptrend support in early April, the Nasdaq Composite Index (Figure 1) looked to be in the final stages of forming a bearish head & shoulders (H&S) pattern with neckline around 4,000 on May 8, 2014. |
|
| Figure 1. Daily chart of the Nasdaq Composite index showing the bearish H&S pattern nearing completion showing areas of support around 3,800 and then 3,700 as well as the broken uptrend support line (blue). |
| Graphic provided by: TC2000.com. |
| |
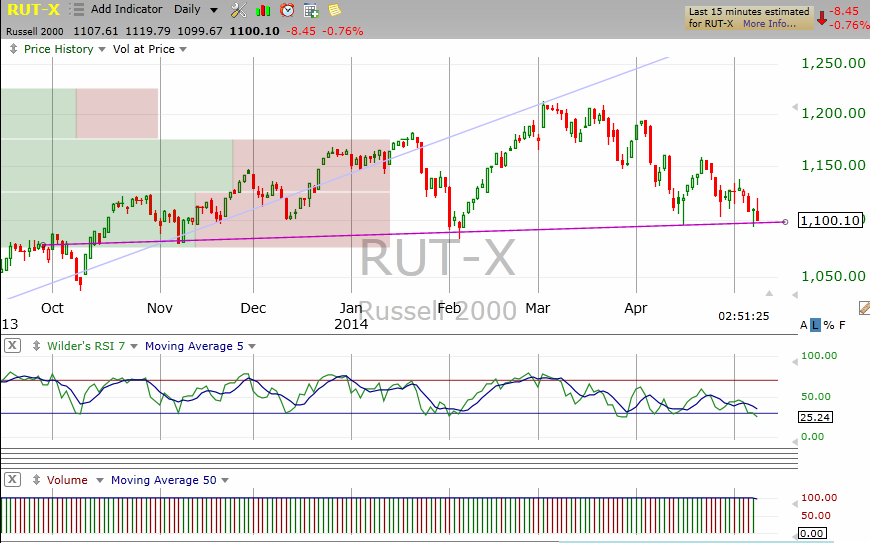
| Next, look at the chart of the Russell 2000 in Figure 2, which after posting a bullish hammer candlestick pattern, flashed an inverted hammer that can signal a bullish reversal but the hammer failure makes it less so. A decisive breach of the RUT neckline at 1,100 would create a minimum projected downside target on the index of 1,000. |
|
| Figure 2. Daily chart of the Russell 2000 index showing the final stages of a H&S pattern. |
| Graphic provided by: TC2000.com. |
| |
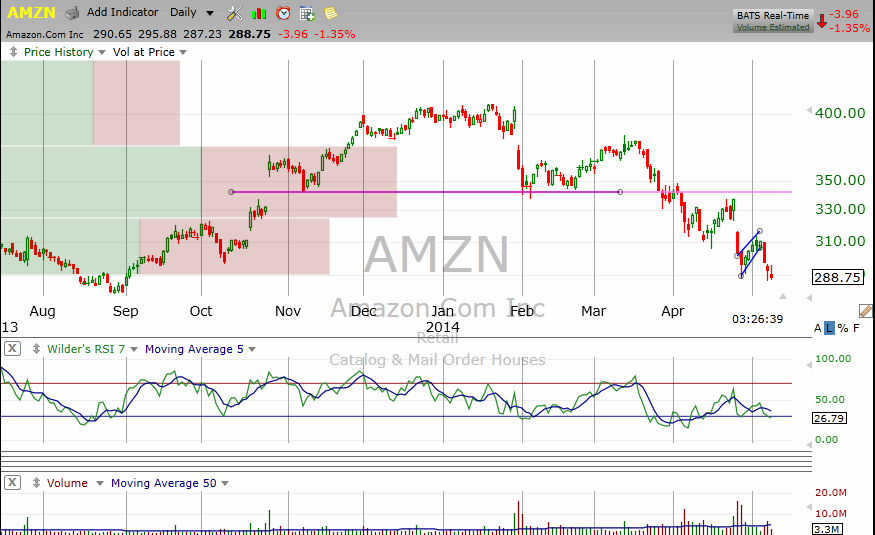
| As discussed in "Amazon - Investors Not Lovin' It," AMZN headed yet lower as investors continued to punish this once high flier. As you see in the chart in Figure 3, in the wake of its most recent bear flag, the stock is now at the September 2013 support level that if broken could see the stock quickly drop to the next support level at $279. |
|
| Figure 3. Daily chart of Amazon (AMZN) showing the H&S pattern followed by a number of bear flags. |
| Graphic provided by: TC2000.com. |
| |
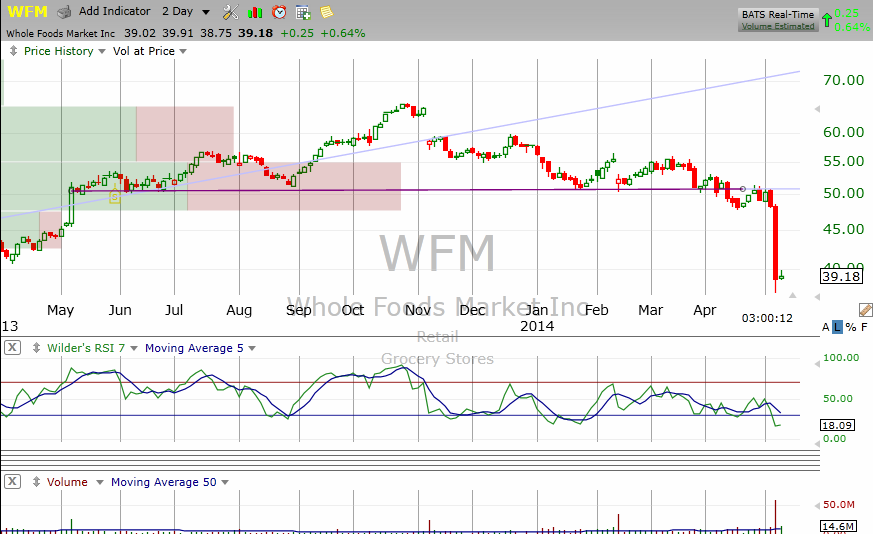
| Another prior market darling, Whole Foods (WFM) is also experiencing its share of troubles after the stock confirmed its H&S pattern in early April only to gap down another $10 on May 7, 2014 in the wake of a disappointing Q2- 2014 earnings report (Figure 4). |
|
| Figure 4. Two day chart showing the bearish H&S pattern on the chart of Whole Foods Market (WFM). |
| Graphic provided by: TC2000.com. |
| |
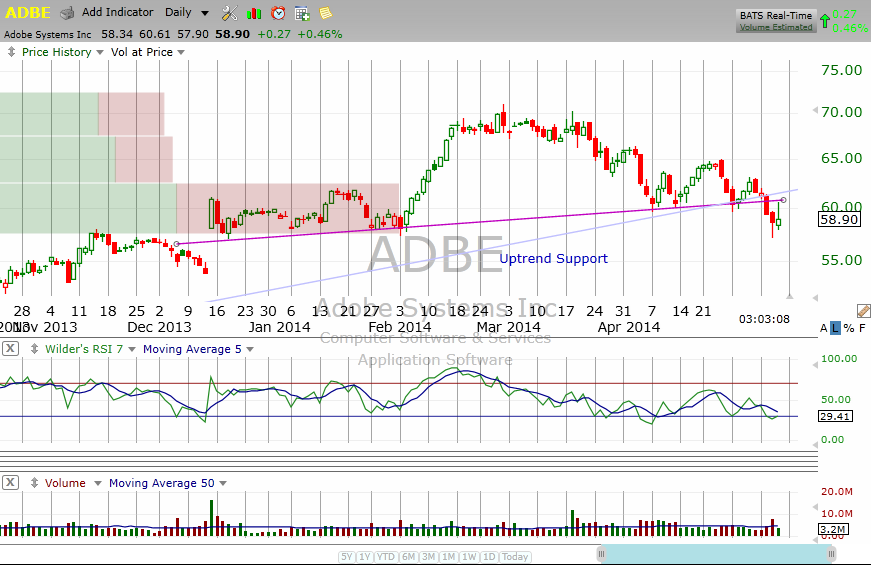 Figure 5. Adobe (ADBE) showing its February 2014 peak followed by the confirmation of an H&S pattern in early May and breach of its uptrend support line. And yet another prior market flyer, Adobe (ADBE) has also experienced serious turbulence since hitting an all-time peak in February. The stock confirmed its H&S pattern on May 6, 2014 with a decisive breach of its neckline just north of $60 (see Figure 5). And these are just a few of the bearish H&S patterns that have been popping up as we enter 'sell in May and go away' season. It is looking increasingly likely that the downdraft markets typically experience post April of the mid-term election cycle is on the doorstep (see "The Election Cycle: Bad News - Good News Story"). |
Matt Blackman is a full-time technical and financial writer and trader. He produces corporate and financial newsletters, and assists clients in getting published in the mainstream media. He is the host of TradeSystemGuru.com. Matt has earned the Chartered Market Technician (CMT) designation. Find out what stocks and futures Matt is watching on Twitter at www.twitter.com/RatioTrade
| Company: | TradeSystemGuru.com |
| Address: | Box 2589 |
| Garibaldi Highlands, BC Canada | |
| Phone # for sales: | 604-898-9069 |
| Fax: | 604-898-9069 |
| Website: | www.tradesystemguru.com |
| E-mail address: | indextradermb@gmail.com |
Traders' Resource Links | |
| TradeSystemGuru.com has not added any product or service information to TRADERS' RESOURCE. | |
Click here for more information about our publications!
Comments
Date:�05/15/14Rank:�4Comment:�I always find these type of articles insightful, confirming what my thoughts are, on a potential near term correction. Enjoy these articles, keep them coming!

Request Information From Our Sponsors
- StockCharts.com, Inc.
- Candle Patterns
- Candlestick Charting Explained
- Intermarket Technical Analysis
- John Murphy on Chart Analysis
- John Murphy's Chart Pattern Recognition
- John Murphy's Market Message
- MurphyExplainsMarketAnalysis-Intermarket Analysis
- MurphyExplainsMarketAnalysis-Visual Analysis
- StockCharts.com
- Technical Analysis of the Financial Markets
- The Visual Investor
- VectorVest, Inc.
- Executive Premier Workshop
- One-Day Options Course
- OptionsPro
- Retirement Income Workshop
- Sure-Fire Trading Systems (VectorVest, Inc.)
- Trading as a Business Workshop
- VectorVest 7 EOD
- VectorVest 7 RealTime/IntraDay
- VectorVest AutoTester
- VectorVest Educational Services
- VectorVest OnLine
- VectorVest Options Analyzer
- VectorVest ProGraphics v6.0
- VectorVest ProTrader 7
- VectorVest RealTime Derby Tool
- VectorVest Simulator
- VectorVest Variator
- VectorVest Watchdog