

HOT TOPICS LIST
- MACD
- Fibonacci
- RSI
- Gann
- ADXR
- Stochastics
- Volume
- Triangles
- Futures
- Cycles
- Volatility
- ZIGZAG
- MESA
- Retracement
- Aroon
INDICATORS LIST
LIST OF TOPICS
PRINT THIS ARTICLE
by Matt Blackman
The Election Cycle has been called the most powerful short-term stock market cycle and it's saying stocks are headed lower. But there is some light at the end of this tunnel if history is any guide.
Position: N/A
Matt Blackman
Matt Blackman is a full-time technical and financial writer and trader. He produces corporate and financial newsletters, and assists clients in getting published in the mainstream media. He is the host of TradeSystemGuru.com. Matt has earned the Chartered Market Technician (CMT) designation. Find out what stocks and futures Matt is watching on Twitter at www.twitter.com/RatioTrade
PRINT THIS ARTICLE
CYCLES
The Election Cycle: Bad News - Good News Story
04/30/14 04:11:54 PMby Matt Blackman
The Election Cycle has been called the most powerful short-term stock market cycle and it's saying stocks are headed lower. But there is some light at the end of this tunnel if history is any guide.
Position: N/A
| Most traders have heard of the four-year Presidential Election Cycle because it has had such a powerful influence on markets. Between 1833 and 2013, post-election, mid-term, pre-election, and election years have averaged stock gains of 2.0%, 4.2%, 10.4%, and 5.8% respectively according to the "2014 Trader Trader's Almanac" (Wiley & Sons). By fine tuning this cycle and buying at each mid-term low of each mid-term year in October and selling 26 months later at the end of November of the election year, the hypothetical trader would have captured 93% of all Dow Jones Industrial Average gains between 1902 and 2006 according to our research. (For more on this cycle, please see "Elections as the Most Powerful Short-term Cycle" and "The Election Cycle Meets Mean Reversion") |
|
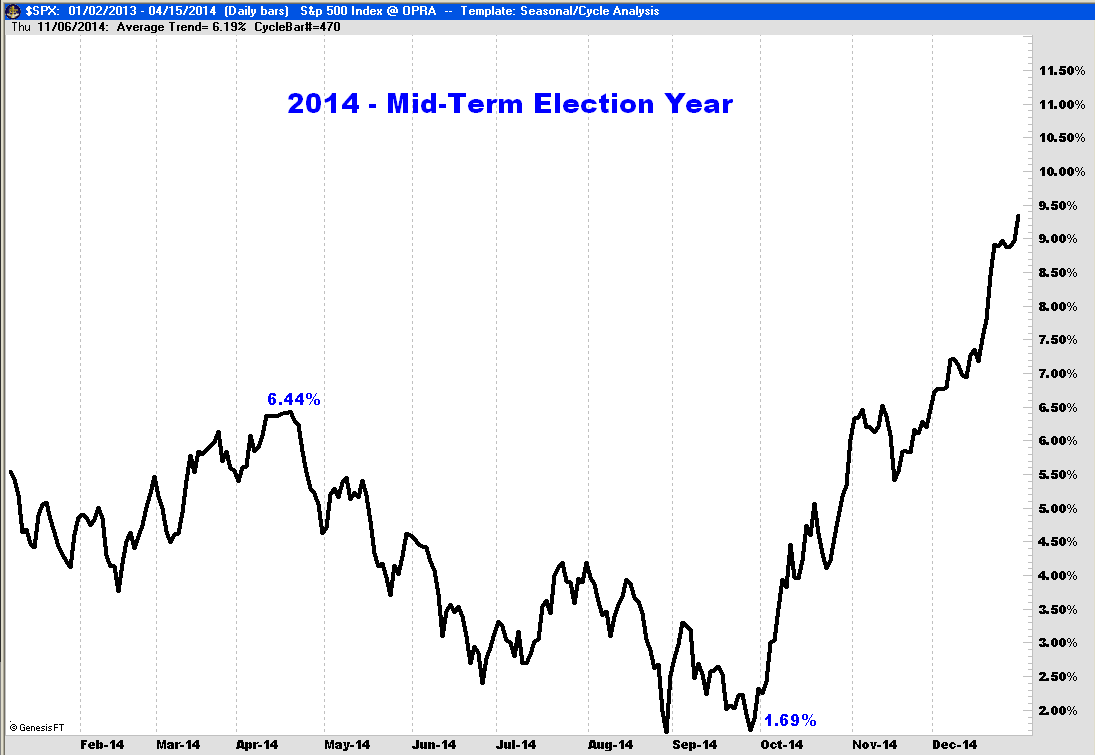
| Figure 1. Composite chart of 22 mid-term election years since 1930 showing how the S&P 500 Index has performed throughout the year, typically putting in a high in mid-April of 6.44% (from the beginning of the post-election year) to a low of 1.69% by the end of September. |
| Graphic provided by: Trade Navigator chart courtesy of GenesisFT.com. |
| |
| As we see in Figure 1 showing a composite of 22 mid-term election years between 1930 and 2014, the S&P 500 Index has typically peaked in mid-April up around 6.5% from the beginning of the post-election year (2013 this cycle) followed by a drop of nearly 5% which has taken the index nearly back to where it started the cycle 16 months before. |
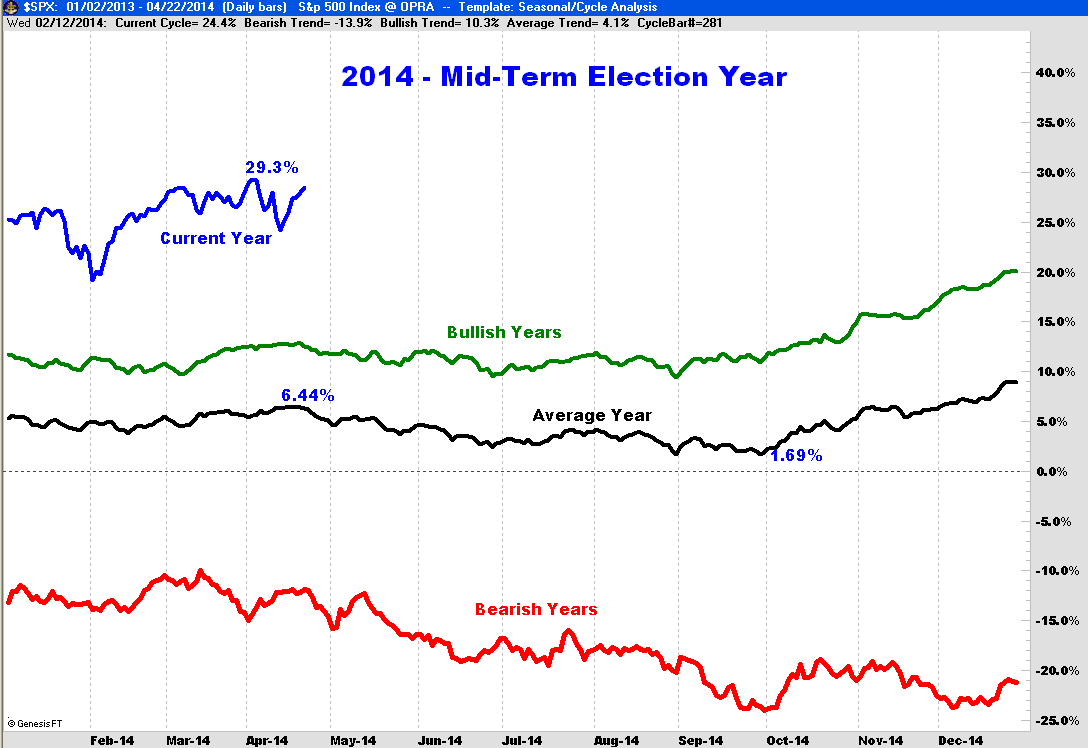
| As we see from the next chart, for the current cycle the S&P 500 was up more than 28% from the beginning of 2013 to April 23, 2014 after peaking at +29.3% in early April. |
|
| Figure 2. Composite chart of mid-term election years showing average of up years (bullish), down years (bearish), average and the current year. |
| Graphic provided by: Trade Navigator chart courtesy of GenesisFT.com. |
| |
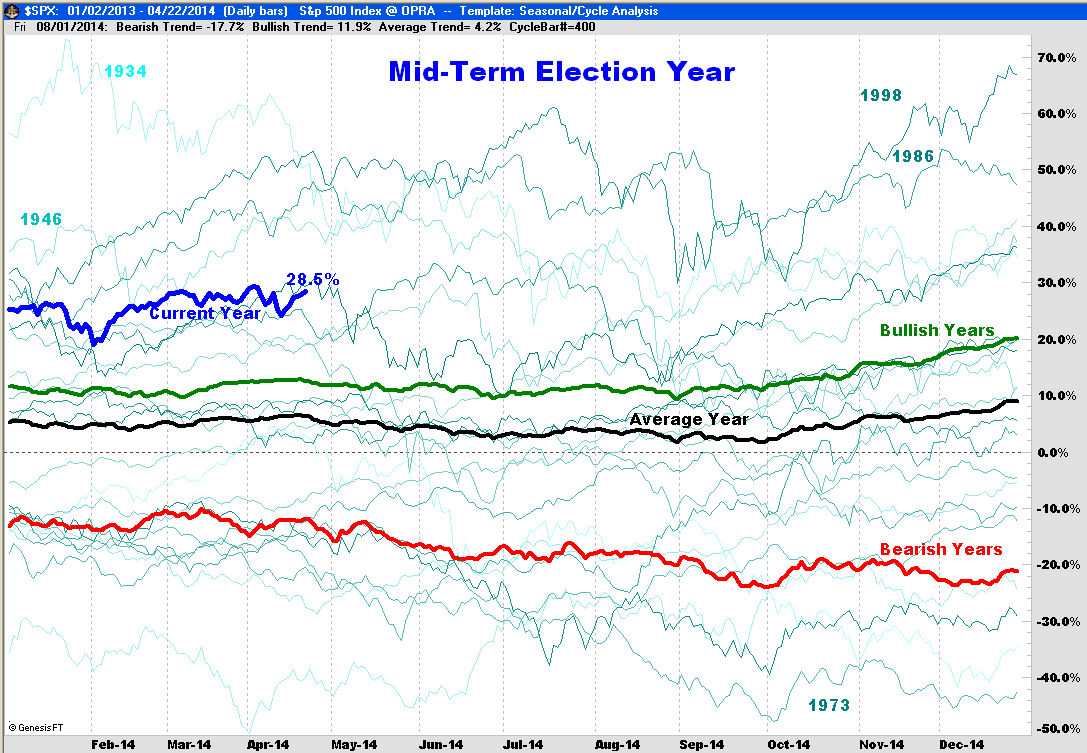
| So what does it all mean for the rest of 2014? From a cycle probability standpoint, stock prices are in rarefied territory. Only four mid-term years since 1930 were higher at this point in the cycle — 1934 (following the major 1933 bottom), 1946 (immediately following World War II), 1986 (near the start of the biggest bull market in history) and 1998. In other words, only once before in a mature bull market (1998) have stock prices been so elevated at this point in the cycle. |
|
| Figure 3. Composite of all mid-term years from 1930 through 2014 showing each mid-term year. |
| Graphic provided by: Trade Navigator chart courtesy of GenesisFT.com. |
| |
| The period from mid-April to the end of September of the mid-term year has been hard on stock prices with the S&P 500 dropping nearly 5% on average. However, the drawdown could be larger this time around due to two factors. First, stock prices are significantly elevated, historically speaking, thanks to extensive quantitative easing programs and two; the Fed has begun tapering these programs which is sure to have a further sobering effect. But the good news is that once this purging has occurred, it's important to point out that stocks have experienced their biggest gains in history leading up to the next Presidential elections. |
Matt Blackman is a full-time technical and financial writer and trader. He produces corporate and financial newsletters, and assists clients in getting published in the mainstream media. He is the host of TradeSystemGuru.com. Matt has earned the Chartered Market Technician (CMT) designation. Find out what stocks and futures Matt is watching on Twitter at www.twitter.com/RatioTrade
| Company: | TradeSystemGuru.com |
| Address: | Box 2589 |
| Garibaldi Highlands, BC Canada | |
| Phone # for sales: | 604-898-9069 |
| Fax: | 604-898-9069 |
| Website: | www.tradesystemguru.com |
| E-mail address: | indextradermb@gmail.com |
Traders' Resource Links | |
| TradeSystemGuru.com has not added any product or service information to TRADERS' RESOURCE. | |
Click here for more information about our publications!
Comments
Date:�05/02/14Rank:�4Comment:�

Request Information From Our Sponsors
- StockCharts.com, Inc.
- Candle Patterns
- Candlestick Charting Explained
- Intermarket Technical Analysis
- John Murphy on Chart Analysis
- John Murphy's Chart Pattern Recognition
- John Murphy's Market Message
- MurphyExplainsMarketAnalysis-Intermarket Analysis
- MurphyExplainsMarketAnalysis-Visual Analysis
- StockCharts.com
- Technical Analysis of the Financial Markets
- The Visual Investor
- VectorVest, Inc.
- Executive Premier Workshop
- One-Day Options Course
- OptionsPro
- Retirement Income Workshop
- Sure-Fire Trading Systems (VectorVest, Inc.)
- Trading as a Business Workshop
- VectorVest 7 EOD
- VectorVest 7 RealTime/IntraDay
- VectorVest AutoTester
- VectorVest Educational Services
- VectorVest OnLine
- VectorVest Options Analyzer
- VectorVest ProGraphics v6.0
- VectorVest ProTrader 7
- VectorVest RealTime Derby Tool
- VectorVest Simulator
- VectorVest Variator
- VectorVest Watchdog