HOT TOPICS LIST
- MACD
- Fibonacci
- RSI
- Gann
- ADXR
- Stochastics
- Volume
- Triangles
- Futures
- Cycles
- Volatility
- ZIGZAG
- MESA
- Retracement
- Aroon
INDICATORS LIST
LIST OF TOPICS
PRINT THIS ARTICLE
by Matt Blackman
What happens when earnings are in line with expectations but spending plans displease?
Position: N/A
Matt Blackman
Matt Blackman is a full-time technical and financial writer and trader. He produces corporate and financial newsletters, and assists clients in getting published in the mainstream media. He is the host of TradeSystemGuru.com. Matt has earned the Chartered Market Technician (CMT) designation. Find out what stocks and futures Matt is watching on Twitter at www.twitter.com/RatioTrade
PRINT THIS ARTICLE
MOMENTUM
Amazon - Investors Not Lovin' It
05/02/14 02:28:37 PMby Matt Blackman
What happens when earnings are in line with expectations but spending plans displease?
Position: N/A
| Like a number of other tech leaders, Amazon (AMZN) was severely punished by investors April 25, 2014 with the stock dropping nearly 10% compared to -1.71% for the Nasdaq Composite Index. This reaction followed on the heels of a Q1-2014 earnings report that showed that net income rose to $108 million or $0.23/share versus $82 million or $0.18/share a year ago. Earnings more or less matched estimates according to Bloomberg but the market punished the stock regardless. |
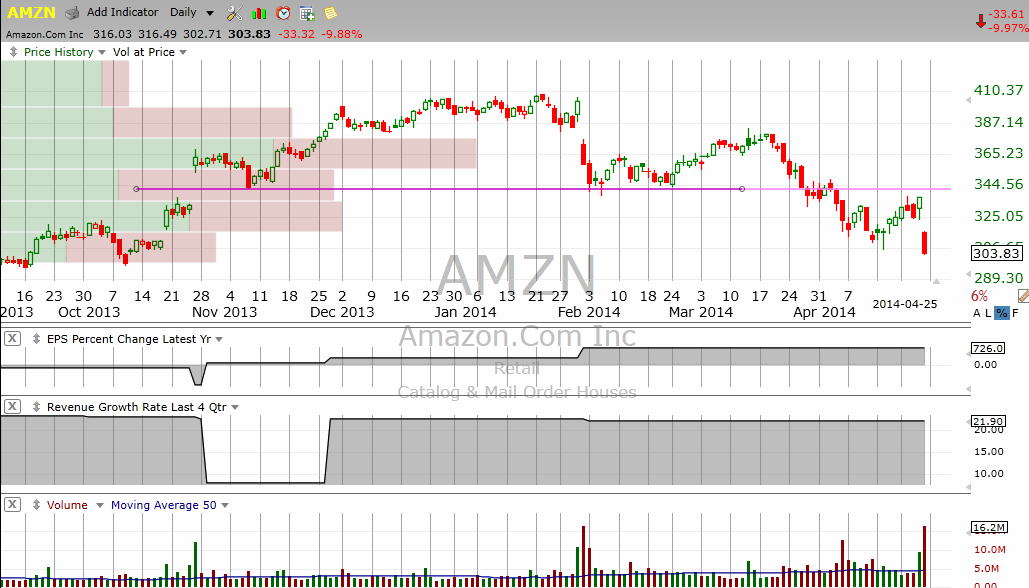
| As we see from the chart in Figure 1, AMZN confirmed a bearish head & shoulders pattern in early April 2014 and the stock is putting in a series of lower lows and lower highs in a confirmed intermediate downtrend after peaking in February. |

|
| Figure 1. Daily chart of AMZN showing the latest head & shoulders pattern and downtrend off the February highs. |
| Graphic provided by: TC2000.com. |
| |
| So what was the problem? In a word, expenses. According to Bloomberg, total operating expenses increased to $19.6 billion from $15.9 billion a year ago, a 23% jump, and fulfillment expenses jumped 29% with technology/content costs surging 44%. The problem is that expanding expenses have squeezed the operating margin to a razor thin 0.7% down from 1.1% a year earlier. Unbridled bullishness has pushed the company's stock price to an astronomical 588 times earnings according to data from TC2000.com, even after accounting for the 25% drop so far this year. To put that number in perspective, the average P/E for companies in the tech heavy Nasdaq Composite Index is more modest but still elevated at 34.5. |

|
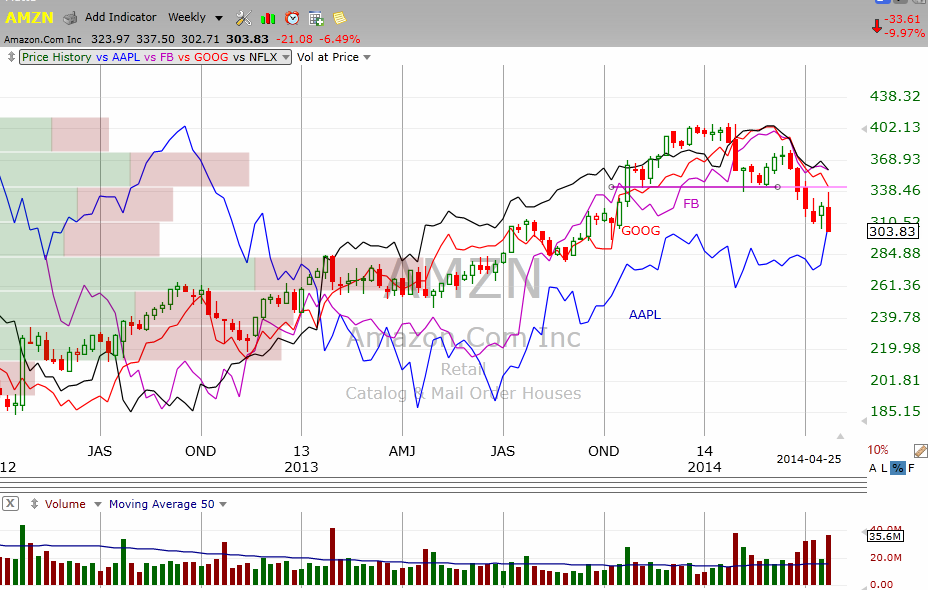
| Figure 2. Weekly chart comparing AMZN with other tech leaders Google (GOOG), Apple (AAPL), Netflix (NFLX) and Facebook (FB). |
| Graphic provided by: TC2000.com. |
| |
| In my July 2013 article entitled, "What's Up With Amazon?" I argued when the stock was trading at $312 which was 3300 times earnings, that a correction was overdue. The stock did experience a correction but then resumed its rally that took it north of $400 in early 2014. |
| This is another example that using pure fundamentals to make buying and selling decisions can be a risky proposition at best because fundamentals tend to lag price action. But when questionable fundamentals are confirmed by bearish chart patterns, resulting trading decisions have a much higher probability of being profitable. The current head & shoulders pattern has a minimum projected downside target of $256. |
Matt Blackman is a full-time technical and financial writer and trader. He produces corporate and financial newsletters, and assists clients in getting published in the mainstream media. He is the host of TradeSystemGuru.com. Matt has earned the Chartered Market Technician (CMT) designation. Find out what stocks and futures Matt is watching on Twitter at www.twitter.com/RatioTrade
| Company: | TradeSystemGuru.com |
| Address: | Box 2589 |
| Garibaldi Highlands, BC Canada | |
| Phone # for sales: | 604-898-9069 |
| Fax: | 604-898-9069 |
| Website: | www.tradesystemguru.com |
| E-mail address: | indextradermb@gmail.com |
Traders' Resource Links | |
| TradeSystemGuru.com has not added any product or service information to TRADERS' RESOURCE. | |
Click here for more information about our publications!
Comments

|

Request Information From Our Sponsors
- StockCharts.com, Inc.
- Candle Patterns
- Candlestick Charting Explained
- Intermarket Technical Analysis
- John Murphy on Chart Analysis
- John Murphy's Chart Pattern Recognition
- John Murphy's Market Message
- MurphyExplainsMarketAnalysis-Intermarket Analysis
- MurphyExplainsMarketAnalysis-Visual Analysis
- StockCharts.com
- Technical Analysis of the Financial Markets
- The Visual Investor
- VectorVest, Inc.
- Executive Premier Workshop
- One-Day Options Course
- OptionsPro
- Retirement Income Workshop
- Sure-Fire Trading Systems (VectorVest, Inc.)
- Trading as a Business Workshop
- VectorVest 7 EOD
- VectorVest 7 RealTime/IntraDay
- VectorVest AutoTester
- VectorVest Educational Services
- VectorVest OnLine
- VectorVest Options Analyzer
- VectorVest ProGraphics v6.0
- VectorVest ProTrader 7
- VectorVest RealTime Derby Tool
- VectorVest Simulator
- VectorVest Variator
- VectorVest Watchdog
