

HOT TOPICS LIST
- MACD
- Fibonacci
- RSI
- Gann
- ADXR
- Stochastics
- Volume
- Triangles
- Futures
- Cycles
- Volatility
- ZIGZAG
- MESA
- Retracement
- Aroon
INDICATORS LIST
LIST OF TOPICS
PRINT THIS ARTICLE
by Matt Blackman
AMZN stock has been on fire since bottoming in November 2008. But the same can't be said for revenues and earnings. So why has the stock soared?
Position: Sell
Matt Blackman
Matt Blackman is a full-time technical and financial writer and trader. He produces corporate and financial newsletters, and assists clients in getting published in the mainstream media. He is the host of TradeSystemGuru.com. Matt has earned the Chartered Market Technician (CMT) designation. Find out what stocks and futures Matt is watching on Twitter at www.twitter.com/RatioTrade
PRINT THIS ARTICLE
PRICE/EARNINGS RATIO
What's Up With Amazon?
07/30/13 01:43:34 PMby Matt Blackman
AMZN stock has been on fire since bottoming in November 2008. But the same can't be said for revenues and earnings. So why has the stock soared?
Position: Sell
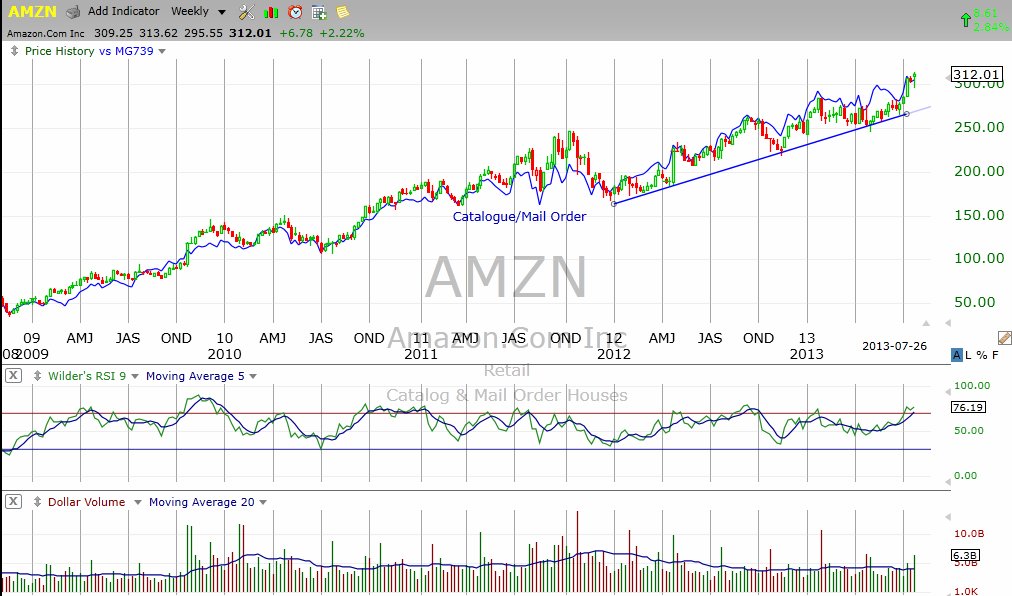
| Since bottoming in November 2008, the price for a share of Amazon (AMZN) stock has jumped from a low of $34.68 to more than $312, an increase of 800%. But if an investor were to assume that this meteoric rise was due to a rapidly improving revenue and earnings picture for the company, they'd be wrong. |
|
| Figure 1 � Daily chart of Amazon showing the incredible run since the 2008 lows. |
| Graphic provided by: TC2000.com. |
| |
| In fact, AMZN fundamental metrics are downright spooky. Over the last five years, the earnings growth rate has been a dismal -23.77%, pushing the price/earnings ratio to a gravity defying 3,300 times which is 4,382% above the five-year average according to data from TC2000.com. Put another way, AMZN stock has increased 800% while sales have increased just 30% and profitability (and margins) have plummeted. |
|
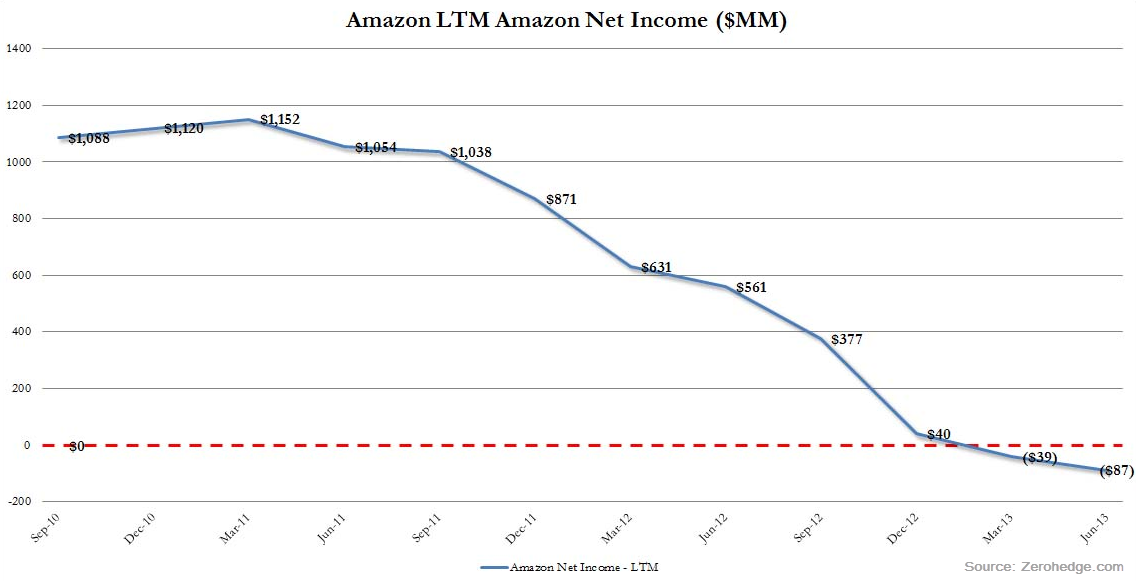
| Figure 2 � Graph showing the change in net income for Amazon.com since September 2010 � a very different picture than the price chart. |
| Graphic provided by: Zerohedge.com. |
| |
| And even though revenues disappointed and Amazon lost two cents a share versus an expectation for a five cent increase and the company warned investors to expect further losses in Q3-2013, the stock price jumped 2.90% the next day! |
| So what has caused such investor enthusiasm for a company with a negative earnings trend? This isn't the first time that AMZN stock has been bid into the stratosphere. Between January 1, 1998 and December 31, 1999 the stock price increased more than 2100% from $5.00 to $113 (post split) only to plummet back to the mid-$5 range in 2001, a drop of more than 95%. |
| This is just another example of a situation that must cause the fundamental investor no end of confusion. How does such a deteriorating earnings situation co-exist with such blatant irrational exuberance in the company's stock price? I wonder what Eugene Fama, creator of the efficient market hypothesis, might have to say about the price of AMZN these days? One of two things will have to happen. Either the acquisitions and investments Amazon has been making will start to yield significantly better earnings in the near future or the stock price will at some point change to reflect the true earnings picture. |
Matt Blackman is a full-time technical and financial writer and trader. He produces corporate and financial newsletters, and assists clients in getting published in the mainstream media. He is the host of TradeSystemGuru.com. Matt has earned the Chartered Market Technician (CMT) designation. Find out what stocks and futures Matt is watching on Twitter at www.twitter.com/RatioTrade
| Company: | TradeSystemGuru.com |
| Address: | Box 2589 |
| Garibaldi Highlands, BC Canada | |
| Phone # for sales: | 604-898-9069 |
| Fax: | 604-898-9069 |
| Website: | www.tradesystemguru.com |
| E-mail address: | indextradermb@gmail.com |
Traders' Resource Links | |
| TradeSystemGuru.com has not added any product or service information to TRADERS' RESOURCE. | |
Click here for more information about our publications!
Comments
Date:�08/01/13Rank:�5Comment:�Interesting insights.. I ve been short on AMZN purely off Technicals. Looking to exit around $260

Request Information From Our Sponsors
- StockCharts.com, Inc.
- Candle Patterns
- Candlestick Charting Explained
- Intermarket Technical Analysis
- John Murphy on Chart Analysis
- John Murphy's Chart Pattern Recognition
- John Murphy's Market Message
- MurphyExplainsMarketAnalysis-Intermarket Analysis
- MurphyExplainsMarketAnalysis-Visual Analysis
- StockCharts.com
- Technical Analysis of the Financial Markets
- The Visual Investor
- VectorVest, Inc.
- Executive Premier Workshop
- One-Day Options Course
- OptionsPro
- Retirement Income Workshop
- Sure-Fire Trading Systems (VectorVest, Inc.)
- Trading as a Business Workshop
- VectorVest 7 EOD
- VectorVest 7 RealTime/IntraDay
- VectorVest AutoTester
- VectorVest Educational Services
- VectorVest OnLine
- VectorVest Options Analyzer
- VectorVest ProGraphics v6.0
- VectorVest ProTrader 7
- VectorVest RealTime Derby Tool
- VectorVest Simulator
- VectorVest Variator
- VectorVest Watchdog