

HOT TOPICS LIST
- MACD
- Fibonacci
- RSI
- Gann
- ADXR
- Stochastics
- Volume
- Triangles
- Futures
- Cycles
- Volatility
- ZIGZAG
- MESA
- Retracement
- Aroon
INDICATORS LIST
LIST OF TOPICS
PRINT THIS ARTICLE
by Matt Blackman
Barely six weeks after flashing a Head & Shoulders top sell signal, TSLA has issued the reverse buy signal on an inverse H&S breakout.
Position: Buy
Matt Blackman
Matt Blackman is a full-time technical and financial writer and trader. He produces corporate and financial newsletters, and assists clients in getting published in the mainstream media. He is the host of TradeSystemGuru.com. Matt has earned the Chartered Market Technician (CMT) designation. Find out what stocks and futures Matt is watching on Twitter at www.twitter.com/RatioTrade
PRINT THIS ARTICLE
OPTIONS ANALYSIS
Tesla Buy Signal
12/13/13 03:57:56 PMby Matt Blackman
Barely six weeks after flashing a Head & Shoulders top sell signal, TSLA has issued the reverse buy signal on an inverse H&S breakout.
Position: Buy
| Tesla has again shown that it deserves its title as the stock short traders love to hate. The stock posted a head & shoulders top pattern sell signal in the third week of November before unexpectedly reversing and in the process catching anyone who took the signal off guard only to then quickly reverse again and hit the pattern target (see "Is Tesla Set to Go Into Reverse" and "Tesla H&S Trade Update"). |
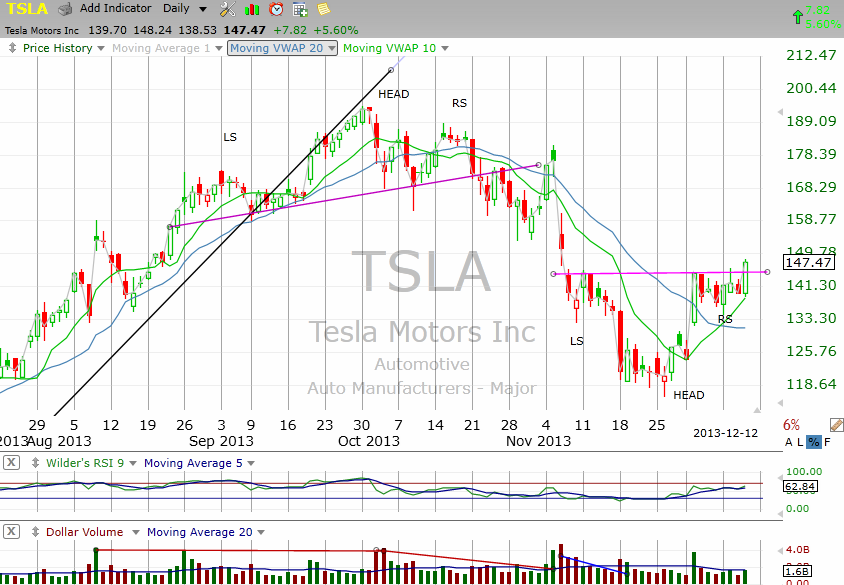
| Now the stock appears to have pulled another quick reversal with a flip-side inverse head & shoulders pattern that was confirmed December 12, 2013 with a break above the new pattern neckline (see Figure 1) after the stock posted a 5.6% daily gain. |
|
| Figure 1, Daily chart of TSLA showing the back-to-back Head & Shoulders patterns with the neckline breakout on December 12, 2013. |
| Graphic provided by: TC2000.com. |
| |
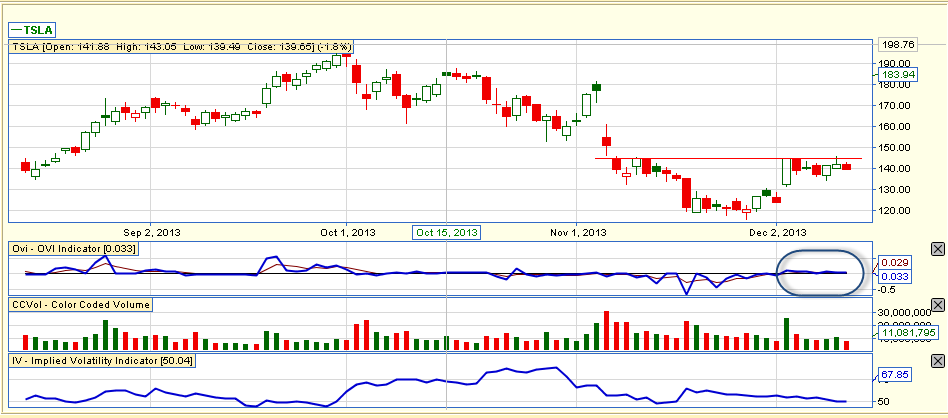
| As Figure 2 of the TSLA OVI indicator and Implied Volatility show, options traders were mildly bullish on the stock as of December 11 with a slightly positive OVI reading of +0.033. OVI measures options transaction activity according to Guy Cohen of FlagTrader.com who developed the indicator. It has a range of values from +1 to -1. A positive OVI reading often occurs ahead of rising stock prices while negative readings typically precede falling prices. |
|
| Figure 2. Daily chart of TSLA showing options trading activity in the stock via the OVI indicator to December 11 before the 5.6% gain December 12. Options traders have been mildly bullish on the stock since the beginning of December. |
| Graphic provided by: www.FlagTraders.com. |
| |
| Before topping out on September 30, 2013, Tesla soared 400% from the beginning of 2013 and in the process put in a distinct parabolic blow-off top. The stock then lost more than 28% due to a combination of a disappointing earnings report and a series of very public engine fires before reversing direction again. |
| Volume on December 12 was average meaning that the big move did not require excessive volume which I interpret as mildly bullish. However, we will need to see increasing volume and a resumption of the stock rally over the next few trading days if this reversal is to grow sustainable legs. |
Matt Blackman is a full-time technical and financial writer and trader. He produces corporate and financial newsletters, and assists clients in getting published in the mainstream media. He is the host of TradeSystemGuru.com. Matt has earned the Chartered Market Technician (CMT) designation. Find out what stocks and futures Matt is watching on Twitter at www.twitter.com/RatioTrade
| Company: | TradeSystemGuru.com |
| Address: | Box 2589 |
| Garibaldi Highlands, BC Canada | |
| Phone # for sales: | 604-898-9069 |
| Fax: | 604-898-9069 |
| Website: | www.tradesystemguru.com |
| E-mail address: | indextradermb@gmail.com |
Traders' Resource Links | |
| TradeSystemGuru.com has not added any product or service information to TRADERS' RESOURCE. | |
Click here for more information about our publications!
Comments

Request Information From Our Sponsors
- StockCharts.com, Inc.
- Candle Patterns
- Candlestick Charting Explained
- Intermarket Technical Analysis
- John Murphy on Chart Analysis
- John Murphy's Chart Pattern Recognition
- John Murphy's Market Message
- MurphyExplainsMarketAnalysis-Intermarket Analysis
- MurphyExplainsMarketAnalysis-Visual Analysis
- StockCharts.com
- Technical Analysis of the Financial Markets
- The Visual Investor
- VectorVest, Inc.
- Executive Premier Workshop
- One-Day Options Course
- OptionsPro
- Retirement Income Workshop
- Sure-Fire Trading Systems (VectorVest, Inc.)
- Trading as a Business Workshop
- VectorVest 7 EOD
- VectorVest 7 RealTime/IntraDay
- VectorVest AutoTester
- VectorVest Educational Services
- VectorVest OnLine
- VectorVest Options Analyzer
- VectorVest ProGraphics v6.0
- VectorVest ProTrader 7
- VectorVest RealTime Derby Tool
- VectorVest Simulator
- VectorVest Variator
- VectorVest Watchdog