HOT TOPICS LIST
- MACD
- Fibonacci
- RSI
- Gann
- ADXR
- Stochastics
- Volume
- Triangles
- Futures
- Cycles
- Volatility
- ZIGZAG
- MESA
- Retracement
- Aroon
INDICATORS LIST
LIST OF TOPICS
PRINT THIS ARTICLE
by Matt Blackman
Less than four months after its IPO, Facebook bottomed at $22.67 before rallying 140% to hit a peak of $54.83 on October 18, 2013. But now the stock looks set to post a pattern that should concern anyone who thinks the stock is a hold.
Position: N/A
Matt Blackman
Matt Blackman is a full-time technical and financial writer and trader. He produces corporate and financial newsletters, and assists clients in getting published in the mainstream media. He is the host of TradeSystemGuru.com. Matt has earned the Chartered Market Technician (CMT) designation. Find out what stocks and futures Matt is watching on Twitter at www.twitter.com/RatioTrade
PRINT THIS ARTICLE
IMPLIED VOLATILITY
Bearish Pattern Setting Up on Facebook
11/25/13 05:03:00 PMby Matt Blackman
Less than four months after its IPO, Facebook bottomed at $22.67 before rallying 140% to hit a peak of $54.83 on October 18, 2013. But now the stock looks set to post a pattern that should concern anyone who thinks the stock is a hold.
Position: N/A
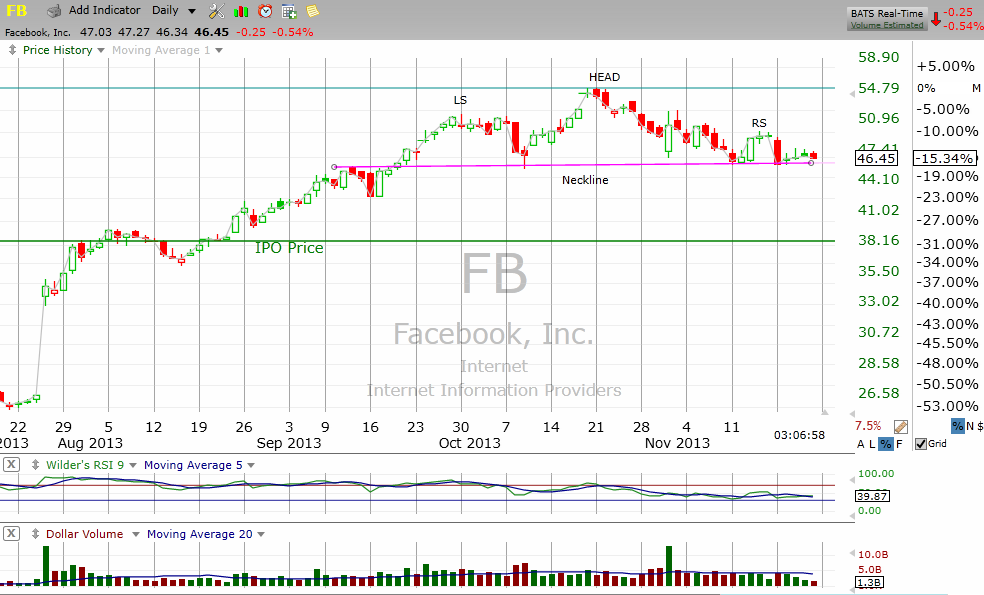
| Hard to believe it's been just 18 months since Facebook first went public. It was a tough first six months but since the summer of 2012, the stock has made a miraculous comeback. However, after hitting its peak near $55 in October and then dropping into November, I began to track the stock more seriously as it continued to exhibit the makings of a bearish Head & Shoulders pattern. And as of writing, FB was hovering just above the neckline. So what's in store for this social media giant? |

|
| Figure 1 – Daily chart of Facebook showing the IPO price and recent bearish Head & Shoulders pattern in the process of being formed. If confirmed with a decisive breach of the neckline, the pattern forecasts a minimum downside target of $36.95. |
| Graphic provided by: TC2000.com. |
| |
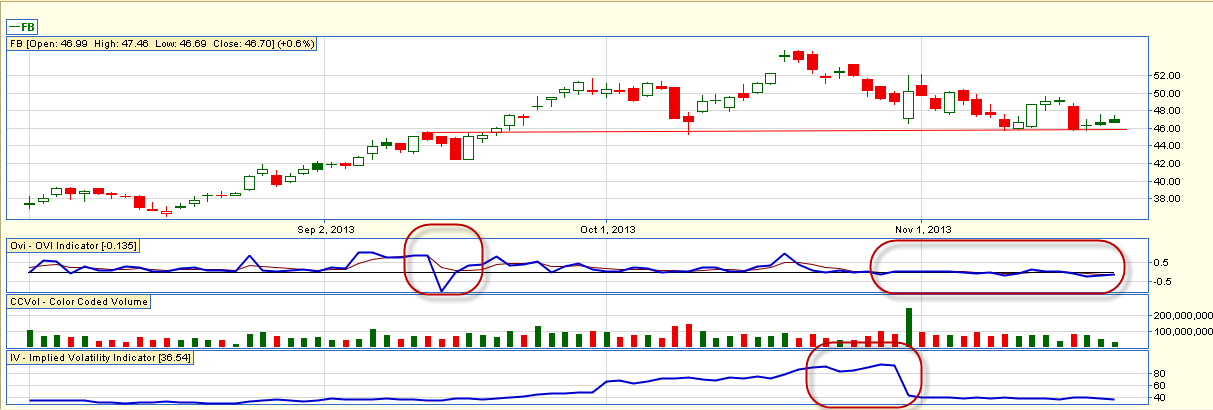
| There are (at least) three more factors to consider. To begin, the first Newtonian law of trading says that a stock will continue in its current trend until a greater force acts upon it to cause a reversal. The trend was decidedly negative in November. Secondly, options traders are getting increasingly negative in their positions on the stock as Figure 2 shows. |
| As mentioned in my previous articles (see Is Tesla Set To Go Into Reverse?), the OVI is an indicator that measures options transaction activity by way of Implied Volatility, Open Interest and Options Volume, according to FlagTrader.com. Values range from +1 to -1. A positive OVI reading occurs ahead of rising stock prices while negative readings typically precede falling prices. |

|
| Figure 2 – Daily chart from FlagTrader.com showing how options traders have been trading Facebook. Note that the OVI indicator (middle subgraph), which turned strongly negative in September has been spending more time in negative territory (right side of chart), showing that traders are getting increasingly negative on the stock. Also note that Implied Volatility in the lower subgraph spiked in late October which often accompanies a trend reversal. |
| Graphic provided by: www.FlagTrader.com. |
| |
| OVI registered a serious negative reading in mid-September which turned out to be the first sign of weakness before the beginning of the H&S pattern, indicating that options traders first began to make bearish bets on the stock while investors were still buying. Following the peak in mid-October, the OVI spent an increasing amount of time below the zero line as options traders bought more puts (and/or sold more calls). |
| Finally, options implied volatility peaked in late October signalling a possible major trend reversal after the five month rally (see middle oval in lower subgraph in Figure 2). So there are three bearish factors on top of the H&S pattern, assuming it gets confirmed. The big caveat, as we learned when a similar pattern appeared on Tesla (see Tesla H&S Trade Update), is that short trades, which are challenging at the best of times, have been more so in this cheap money, quantitative easing, buy the dip, environment. But like the Tesla trade, this FB short trade could be very profitable indeed for those who time it right. |
Matt Blackman is a full-time technical and financial writer and trader. He produces corporate and financial newsletters, and assists clients in getting published in the mainstream media. He is the host of TradeSystemGuru.com. Matt has earned the Chartered Market Technician (CMT) designation. Find out what stocks and futures Matt is watching on Twitter at www.twitter.com/RatioTrade
| Company: | TradeSystemGuru.com |
| Address: | Box 2589 |
| Garibaldi Highlands, BC Canada | |
| Phone # for sales: | 604-898-9069 |
| Fax: | 604-898-9069 |
| Website: | www.tradesystemguru.com |
| E-mail address: | indextradermb@gmail.com |
Traders' Resource Links | |
| TradeSystemGuru.com has not added any product or service information to TRADERS' RESOURCE. | |
Click here for more information about our publications!
Comments

|

Request Information From Our Sponsors
- StockCharts.com, Inc.
- Candle Patterns
- Candlestick Charting Explained
- Intermarket Technical Analysis
- John Murphy on Chart Analysis
- John Murphy's Chart Pattern Recognition
- John Murphy's Market Message
- MurphyExplainsMarketAnalysis-Intermarket Analysis
- MurphyExplainsMarketAnalysis-Visual Analysis
- StockCharts.com
- Technical Analysis of the Financial Markets
- The Visual Investor
- VectorVest, Inc.
- Executive Premier Workshop
- One-Day Options Course
- OptionsPro
- Retirement Income Workshop
- Sure-Fire Trading Systems (VectorVest, Inc.)
- Trading as a Business Workshop
- VectorVest 7 EOD
- VectorVest 7 RealTime/IntraDay
- VectorVest AutoTester
- VectorVest Educational Services
- VectorVest OnLine
- VectorVest Options Analyzer
- VectorVest ProGraphics v6.0
- VectorVest ProTrader 7
- VectorVest RealTime Derby Tool
- VectorVest Simulator
- VectorVest Variator
- VectorVest Watchdog
