HOT TOPICS LIST
- MACD
- Fibonacci
- RSI
- Gann
- ADXR
- Stochastics
- Volume
- Triangles
- Futures
- Cycles
- Volatility
- ZIGZAG
- MESA
- Retracement
- Aroon
INDICATORS LIST
LIST OF TOPICS
PRINT THIS ARTICLE
by Andrew Hetherington
If everyone feels that FedEx (FDX) is invincible they are in for a surprise.
Position: N/A
Andrew Hetherington
Classic Dow Theorist who trades as a pure technician, using pattern recognition.
PRINT THIS ARTICLE
CHART ANALYSIS
FedEx - Fragile, Handle With Care
09/06/02 10:05:03 AMby Andrew Hetherington
If everyone feels that FedEx (FDX) is invincible they are in for a surprise.
Position: N/A
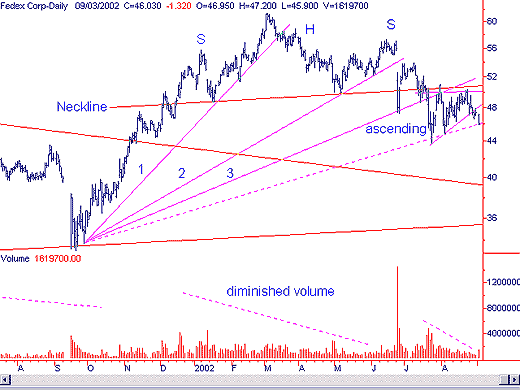
 Figure 1: FedEx daily chart. Looking at the daily chart in Figure 1, you can see that you are in a serious situation if you are holding a long position. There was a downside breakout on an 8-month head and shoulders pattern with perfect volume on the pattern's creation. This breakout was in the $50.00 area and gave every indication that $38.00 was on the horizon. At the same time there was a third fan line break to change direction temporarily. After the head and shoulders breakout it consolidated and formed a 1-month ascending triangle. Once again the volume was excellent on this pattern, diminishing throughout. A downside breakout from this triangle occurred in the $48.00 area. All that is left is for $45.90 to break and the $38.00 support will come into play eventually. Although the ascending triangles have a bullish tendency, clearly the general trend drags everything down. |
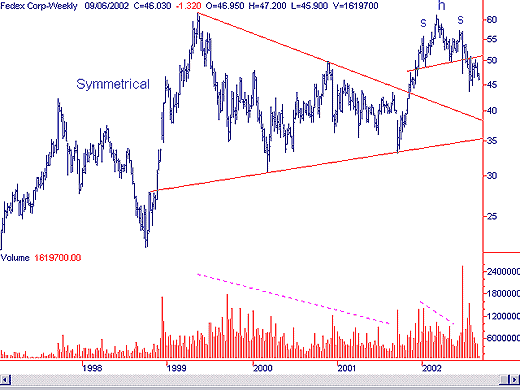
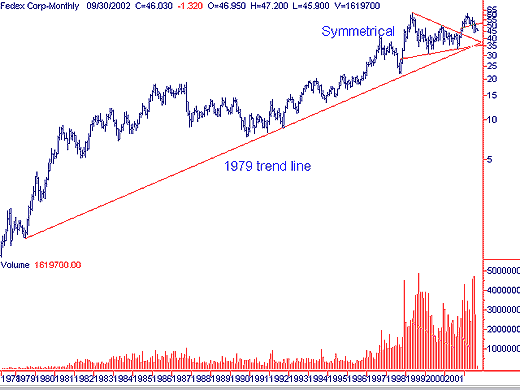
 Figure 2: FedEx weekly chart. The weekly chart shows why the $38.00 area is significant. It's in the cradle of the huge two and a half-year symmetrical triangle that went topside in November 2001. This rally went from $45.00 to $61.00 approximately. The breakout was on strong volume at the time, but looking at the more recent activity there are much larger volumes on the downside. Big players are beginning to bail out in a big way. Incidentally, the long-term 23-year trend is also at the $38.00 support. This trend will likely hold initially, and then the trend can be re-examined at that point. It's a little distant for judging this trendline although prognosticating a downside breaking of this trend is likely in the cards. My previous prognostication of a 5800 Dow, see "The Dow Explanation", will drag this one down along with everything else. Naturally, if my prognostication on the Dow is incorrect then it won't happen since most equities follow the general trend. |

|
| Figure 3: FedEx monthly chart. |
| Graphic provided by: SuperCharts. |
| |
Classic Dow Theorist who trades as a pure technician, using pattern recognition.
| Toronto, Canada |
Click here for more information about our publications!
Comments
Date: 09/10/02Rank: 5Comment:
Date: 09/14/02Rank: 4Comment: I bought option and it look good at this moment
Date: 09/17/02Rank: 4Comment:

Request Information From Our Sponsors
- VectorVest, Inc.
- Executive Premier Workshop
- One-Day Options Course
- OptionsPro
- Retirement Income Workshop
- Sure-Fire Trading Systems (VectorVest, Inc.)
- Trading as a Business Workshop
- VectorVest 7 EOD
- VectorVest 7 RealTime/IntraDay
- VectorVest AutoTester
- VectorVest Educational Services
- VectorVest OnLine
- VectorVest Options Analyzer
- VectorVest ProGraphics v6.0
- VectorVest ProTrader 7
- VectorVest RealTime Derby Tool
- VectorVest Simulator
- VectorVest Variator
- VectorVest Watchdog
- StockCharts.com, Inc.
- Candle Patterns
- Candlestick Charting Explained
- Intermarket Technical Analysis
- John Murphy on Chart Analysis
- John Murphy's Chart Pattern Recognition
- John Murphy's Market Message
- MurphyExplainsMarketAnalysis-Intermarket Analysis
- MurphyExplainsMarketAnalysis-Visual Analysis
- StockCharts.com
- Technical Analysis of the Financial Markets
- The Visual Investor
