HOT TOPICS LIST
- MACD
- Fibonacci
- RSI
- Gann
- ADXR
- Stochastics
- Volume
- Triangles
- Futures
- Cycles
- Volatility
- ZIGZAG
- MESA
- Retracement
- Aroon
INDICATORS LIST
LIST OF TOPICS
PRINT THIS ARTICLE
by Andrew Hetherington
Over the past several weeks I have observed few who would actually make a prognostication on the Dow. I did hear analysts mention the number 7400 once or twice as the bottom but did not see an acceptable chart to back them up. Here's my analysis of the state of the Dow and my predictions for current and future movement.
Position: N/A
Andrew Hetherington
Classic Dow Theorist who trades as a pure technician, using pattern recognition.
PRINT THIS ARTICLE
CHART ANALYSIS
The Dow Explanation
07/26/02 10:51:36 AMby Andrew Hetherington
Over the past several weeks I have observed few who would actually make a prognostication on the Dow. I did hear analysts mention the number 7400 once or twice as the bottom but did not see an acceptable chart to back them up. Here's my analysis of the state of the Dow and my predictions for current and future movement.
Position: N/A
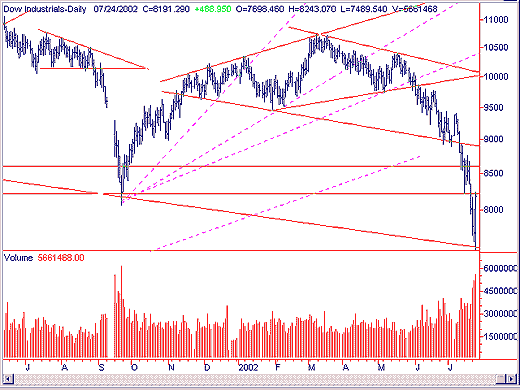
 Figure 1: Daily chart of the Dow. Figure 1 shows the Dow Industrials daily chart with an 8-month broadening top. It is not a broadening formation or a head and shoulders pattern since the volume does not confirm either one. Following is a perfect 4-month symmetrical triangle with perfect volume on the creation of the pattern. In addition, there is a third fan line break in the 10,000 area before the symmetrical breakout. There is a breakout to the 9229 area and the usual pullback to the sell short position of 9775. The inevitable slide down to the supports of 8600, 8200 and finally 7500 where the much larger broadening top support line will hold temporarily. There was a hesitation in the 8600 and 8200 areas but it was a safe bet that these supports would not hold given that two consecutive patterns broke to the downside and this also happened to break the 20-year trend on the Dow in the 9500 area. The breaking of this long-term trend was of major significance. |
| Drawing conservative lines was most important while trying to catch the bottom today. Some had it pegged at the 7400 while others were at 7600. The 7500 broadening line was a sure bet since there was a horizontal support that intersected with the broadening line at 7500. This mountain of evidence helped the astute trader purchase the $86.00 Dow call options at 0.20 cents today (7/24/02) on the open, and they closed at $1.50. That's a good profit for one day. The Dow call options for the $76.00 strike went from $2.90 to $7.50 for those who prefer to trade in the money. Lastly, there was a one-day reversal with extraordinary volume on the Dow today to signal a temporary reversal of trend, but this pattern does not have major trend implications. In addition, many Dow equities recently constructed and broke out of bearish patterns, such as American Express, Dupont, International Paper, Proctor & Gamble, Citigroup and Microsoft to name a few. |

|
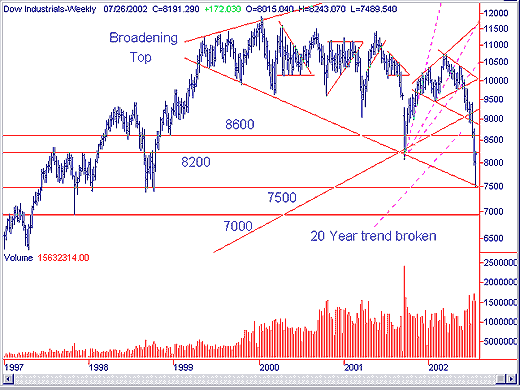
| Figure 2: Dow weekly chart. |
| Graphic provided by: SuperCharts. |
| |
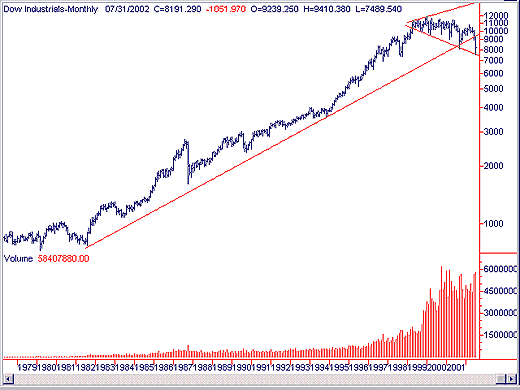
 Figure 3: Monthly chart of the Dow. |
| On the weekly chart a much larger broadening top is forming with the assortment of other patterns within it. The supports are clearly defined. The monthly chart illustrates the 20-year trend that has been broken along with the irregular volume throughout the construction of the pattern. |
| Where are we headed? Prognosticating far in advance is very difficult to quantify but it seems clear to me that the larger broadening top will break the next time down in the 7500 area. This line is sloped so it might be lower when this happens. The next support in the 7000 area will not hold and we will likely see 5800 on the Dow. I expect today's bounce up to be in the 8600-8900 areas at which point the smaller broadening top resistance line will push it down once again. Naturally, it may not bounce up this high but it won't go higher than 8900 at which point taking a short position will be the prudent trade. If the 5800 supports don't hold strong then the next stop will be 4000, but I'm not ready to make that prognostication. I'm merely illustrating the support level. The S&P 500 also broke its 20-year trend around the same time as the Dow. As for the Nasdaq, its 22-year trend is in the 950 areas and hasn't broken yet. |
Classic Dow Theorist who trades as a pure technician, using pattern recognition.
| Toronto, Canada |
Click here for more information about our publications!
Comments
Date: 07/27/02Rank: 5Comment:
Date: 07/28/02Rank: 5Comment:
Date: 07/29/02Rank: 5Comment: This article is most timely considering the current market and Andy, perhaps you couldn t be more right.
Great!
Date: 07/30/02Rank: 5Comment:
Date: 07/30/02Rank: 5Comment:
Date: 07/30/02Rank: 5Comment:
Date: 07/30/02Rank: 4Comment: this seems to be agreeing with Precther s call for a great bear bath and the von Mises Institute economics that call for the same.
If USA economic/tax policy DOES NOT change, I fear that the Canadian gets the gold star.
Date: 07/30/02Rank: 5Comment:
Date: 07/31/02Rank: 5Comment:
Date: 07/31/02Rank: 4Comment:
Date: 08/03/02Rank: 5Comment:
Date: 08/05/02Rank: 4Comment:
Date: 08/05/02Rank: 4Comment:
Date: 08/17/02Rank: 5Comment:
Date: 09/30/02Rank: 5Comment:

Request Information From Our Sponsors
- StockCharts.com, Inc.
- Candle Patterns
- Candlestick Charting Explained
- Intermarket Technical Analysis
- John Murphy on Chart Analysis
- John Murphy's Chart Pattern Recognition
- John Murphy's Market Message
- MurphyExplainsMarketAnalysis-Intermarket Analysis
- MurphyExplainsMarketAnalysis-Visual Analysis
- StockCharts.com
- Technical Analysis of the Financial Markets
- The Visual Investor
- VectorVest, Inc.
- Executive Premier Workshop
- One-Day Options Course
- OptionsPro
- Retirement Income Workshop
- Sure-Fire Trading Systems (VectorVest, Inc.)
- Trading as a Business Workshop
- VectorVest 7 EOD
- VectorVest 7 RealTime/IntraDay
- VectorVest AutoTester
- VectorVest Educational Services
- VectorVest OnLine
- VectorVest Options Analyzer
- VectorVest ProGraphics v6.0
- VectorVest ProTrader 7
- VectorVest RealTime Derby Tool
- VectorVest Simulator
- VectorVest Variator
- VectorVest Watchdog
