HOT TOPICS LIST
- MACD
- Fibonacci
- RSI
- Gann
- ADXR
- Stochastics
- Volume
- Triangles
- Futures
- Cycles
- Volatility
- ZIGZAG
- MESA
- Retracement
- Aroon
INDICATORS LIST
LIST OF TOPICS
PRINT THIS ARTICLE
by David Penn
An intraday look at the S&P 500 anticipates a near-term correction in the index's July-August advance.
Position: N/A
David Penn
Technical Writer for Technical Analysis of STOCKS & COMMODITIES magazine, Working-Money.com, and Traders.com Advantage.
PRINT THIS ARTICLE
HEAD & SHOULDERS
The S&P 500's Other Head and Shoulders Top
08/28/02 12:59:23 PMby David Penn
An intraday look at the S&P 500 anticipates a near-term correction in the index's July-August advance.
Position: N/A
| No matter how many intelligent traders and technical analysts remind us how important it is to look at multiple time frames, I fear that too many of us have not made studying multiple time frames a regular part of our charting regimen. Increasingly, as I have paid more and more attention to the intraday S&P 500, I have found it easier to keep track with both the 5-minute movements as well as the daily and weekly movements of the S&P 500. For example, I wrote about the head and shoulders top in the weekly charts of the S&P 500 back in July ("The S&P 500's Five-Year Head and Shoulders Hangover", Traders.com Advantage, 7/2/02). This pattern, which since has been widely commented on by technical analysts, suggests a sizable correction in the S&P 500, one that could take the index (and its futures) down to as low as 400. |
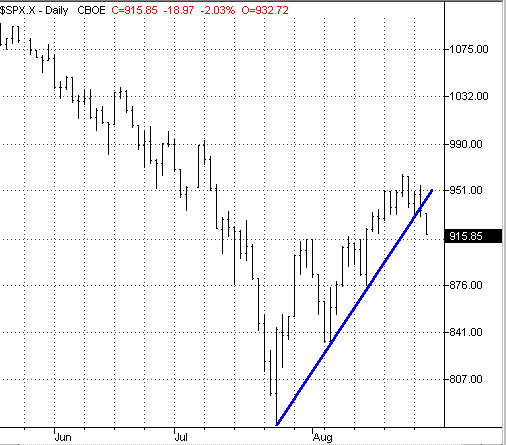
| At the time, I did allow for what I then called "the possibility of a sizable, albeit brief, oversold rally... that took the S&P 500 to a test of its right shoulder high of 1165." This, as I mentioned, would allow for a bear market rally of 15-20%. July, unfortunately, turned out to be a very difficult month for the S&P. But ironically, there was still a bear market rally off of the ultimate July lows that, as of late August, appears to have gained some 24% (July low of 776 to August high of 965). The rally from late July to late August has been sharp, as the trendline indicates. However, there is evidence in late August that the trend is slowing down. This evidence is strongest in the downside trendline break that occurred in the last week of August. The lows of the initial breakdown bar are still in a support area, and there is even greater support at 876 below. But the question here is whether or not the breakdown bar is the harbinger of real declines to come - perhaps even a retest of the year-to-date lows in July - or is simply a profit-taking opportunity from which further gains may be achieved. |

|
| Figure 1: A trendline break in late August threatens the S&P 500's month-old advance. |
| Graphic provided by: TradeStation. |
| |
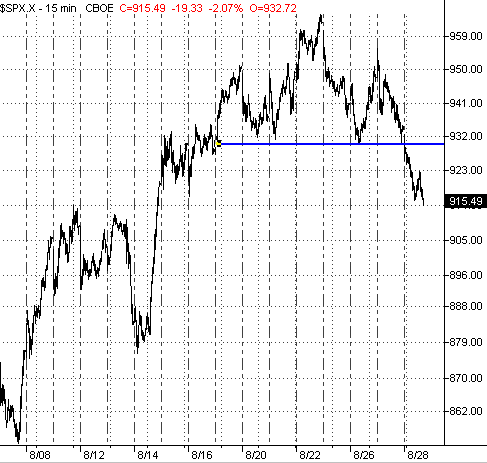
| A close look at the intraday action in the S&P 500 seems to suggest that the correction is real. Whether or not the correction ends up killing the rally and sending the S&P 500 back to a test of its July lows is still in doubt, but the intraday movement of the S&P 500 over the past seven or eight days has traced out a head and shoulders top that seems to point directly toward a test of, at least, the support area at 876. |
 Figure 2: This intraday head and shoulders top in this 15-minute chart of the S&P 500 supports the trendline breakdown on the daily charts. With a formation size of 35 (high 965, low 930), this intraday head and shoulders top suggests a price decline to 895, which is above the major, intraday correction low of August 14th, but does seem to fit in well with the correction lows on August 8th and 12th. There is some resistance from the rally peaks of those same days, as well, making any downside progress beneath 915 a significant achievement, should the S&P actually continue to decline. |
| Importantly, as the topmost chart shows, even a decline to 895 would not negate the uptrend that has been intact ever since the S&P 500 successfully tested its July bottom in early August. In fact, until the S&P 500 declines beneath the previous intermediate low at 876 (much less the low of the successful "2B test of bottom" at 840), there is little reason for S&P bulls (and legions of U.S. equity investors) to panic - yet (see "Elliot Wave and August Advances", Traders.com, 8/13/02). |
Technical Writer for Technical Analysis of STOCKS & COMMODITIES magazine, Working-Money.com, and Traders.com Advantage.
| Title: | Technical Writer |
| Company: | Technical Analysis, Inc. |
| Address: | 4757 California Avenue SW |
| Seattle, WA 98116 | |
| Phone # for sales: | 206 938 0570 |
| Fax: | 206 938 1307 |
| Website: | www.Traders.com |
| E-mail address: | DPenn@traders.com |
Traders' Resource Links | |
| Charting the Stock Market: The Wyckoff Method -- Books | |
| Working-Money.com -- Online Trading Services | |
| Traders.com Advantage -- Online Trading Services | |
| Technical Analysis of Stocks & Commodities -- Publications and Newsletters | |
| Working Money, at Working-Money.com -- Publications and Newsletters | |
| Traders.com Advantage -- Publications and Newsletters | |
| Professional Traders Starter Kit -- Software | |
Click here for more information about our publications!
Comments
Date: 08/31/02Rank: 5Comment: I started trading the S P 500 for the first time Friday night 22/8/02. The first thing I noticed on the hourly chart on Quote.com was the head and shoulders. Thankyou for the confirmation! Trading the S P intraday out of the 5 trades I ve done so far is surprisingly rewarding! Do you know where I can find onother live streaming chart other than Quote.com (only has cash market)?
Date: 09/15/02Rank: 5Comment:

Request Information From Our Sponsors
- StockCharts.com, Inc.
- Candle Patterns
- Candlestick Charting Explained
- Intermarket Technical Analysis
- John Murphy on Chart Analysis
- John Murphy's Chart Pattern Recognition
- John Murphy's Market Message
- MurphyExplainsMarketAnalysis-Intermarket Analysis
- MurphyExplainsMarketAnalysis-Visual Analysis
- StockCharts.com
- Technical Analysis of the Financial Markets
- The Visual Investor
- VectorVest, Inc.
- Executive Premier Workshop
- One-Day Options Course
- OptionsPro
- Retirement Income Workshop
- Sure-Fire Trading Systems (VectorVest, Inc.)
- Trading as a Business Workshop
- VectorVest 7 EOD
- VectorVest 7 RealTime/IntraDay
- VectorVest AutoTester
- VectorVest Educational Services
- VectorVest OnLine
- VectorVest Options Analyzer
- VectorVest ProGraphics v6.0
- VectorVest ProTrader 7
- VectorVest RealTime Derby Tool
- VectorVest Simulator
- VectorVest Variator
- VectorVest Watchdog
