HOT TOPICS LIST
- MACD
- Fibonacci
- RSI
- Gann
- ADXR
- Stochastics
- Volume
- Triangles
- Futures
- Cycles
- Volatility
- ZIGZAG
- MESA
- Retracement
- Aroon
INDICATORS LIST
LIST OF TOPICS
PRINT THIS ARTICLE
by David Penn
Believe it or not, the equity bubble of the 1990s may have only begun to burst.
Position: N/A
David Penn
Technical Writer for Technical Analysis of STOCKS & COMMODITIES magazine, Working-Money.com, and Traders.com Advantage.
PRINT THIS ARTICLE
HEAD & SHOULDERS
The S&P 500's Five-year Head and Shoulders Hangover
07/02/02 08:14:26 AMby David Penn
Believe it or not, the equity bubble of the 1990s may have only begun to burst.
Position: N/A
| There's really no way to sugar-coat this one: if basic, old-fashioned chart pattern technical analysis is to be believed, then the equity bubble of the second half of the 1990s has taken the form of a massive head and shoulders top in the S&P 500. What that means is, the carnage of 2000 and 2001 notwithstanding, stocks could have a lot more falling to do before they are through. What is "a lot"? How about a decline over the next few years of as much as 59%, taking the S&P 500 down as far as 401? |
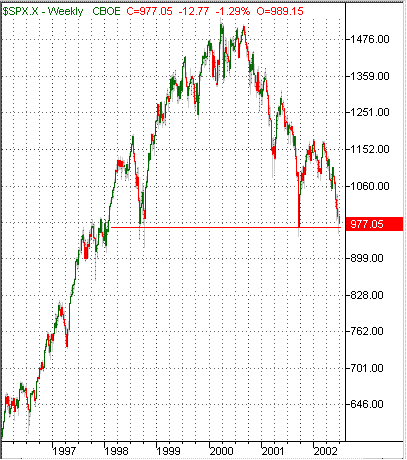
| Before going any further, let's make the case for a collapse in the S&P 500. Many observers believe (after the fact) that the stock bubble really began in earnest with the bailout of Long-Term Capital Management (LTCM) in the fall of 1998. This bailout, so goes the argument, not only created a genuine moral hazard (institutions who engaged in high-risk speculation would increasingly believe the Federal Reserve Board would take care of them if their speculations went badly), but also helped provide the liquidity that made it possible to invest in "profit-free" Internet companies. Whatever the fundamental reasons, the S&P 500 made an intermediate bottom in late 1998 and then proceeded to make a 575-point run to their ultimate top of 1153 in March 2000. This movement completed what would be the first half of the head and shoulders formation. The breakout from the consolidation area that concluded 1997 (a consolidation range between 900 and 970) to the correction low during the LTCM crisis comprises the left shoulder. The rally from the LTCM correction low in 1998 to the all-time S&P 500 high in early 2000 provides for the head, and completes the first half of the formation. |

|
| Figure 1: If this were a stock, would you buy it? The S&P 500 looks loaded for bear, should it break down from this long-term, head and shoulders top. |
| Graphic provided by: TradeStation. |
| |
| The second, bearish half of the formation begins with the retreat from the all-time highs in the spring of 2000. This downward movement culminates in an intermediate bottom a year after the all-time highs are made, in March 2001. After a 6-8 week rally -- a rally which fails to take out the previous high -- the S&P 500 is on its way back down to the lows that would eventually come in the wake of the September 11th terrorist attacks on New York and Washington, D.C. This movement, from the all-time high to the September 11th lows, completed the "head" of the head and shoulders formation. The "war rally," as it has been called by many, came swiftly after the September 11th lows but, again, the rally failed to take out the high of the previous rally that ended in the spring of 2001. What the rally did do, however, was end in an intermediate double top in 2002, with peaks in early January and mid-March. The breakdown from this intermediate double top is what has sent the S&P 500 back to a test of the September 11th lows -- a support area that, as you might recall, also features the correction lows from 1998. |
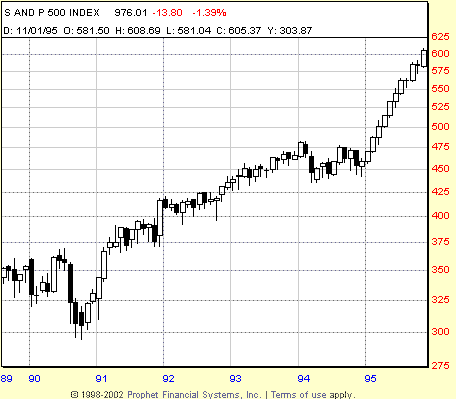
 Figure 2: A breakdown from the head and shoulders top in the S&P 500 could take the index back to values not seen since the recession of 1991. Graphic provided by: Prophet Financial Systems, Inc. One could argue that, at this point, virtually the entire post-LTCM bubble has been retraced -- and, for those who did not take profits during the "bullish" phase of the S&P 500's head and shoulders top, that is exactly what has happened (and, painfully, with more valuable dollars in 2000-01 than in 1997-8). And while many believe the current market to be exceptionally oversold and due for a bounce in the short-term, the longer-term view still looks bleak. If the current lows do not make for strong support and the head and shoulders top asserts itself, then a breakdown beneath 950 or so could have severe consequences. The simple measurement rule for head and shoulders tops (formation size subtracted from the value at the formation low) suggests that the S&P 500 could reach as low as 400 over the next few years. This is given the fact that the formation itself is about four and a half years long (perhaps as long as five years if there is an oversold rally this summer). Where is the S&P at 400? A better question might be "when?" The S&P 500 last closed beneath 400 in November of 1991, during the tail end of the 1990-91 recession. |
| A last note on the possibility of a relief rally in July and August: There is nothing in this suspicion that the S&P 500 is likely to suffer a significant breakdown that contradicts the possibility of a sizable, albeit brief, oversold rally in the S&P 500. For example, a July-August rally that took the S&P 500 to a test of its right shoulder high of 1165 would represent an advance of anywhere from 15% to 20%, which is roughly equal to the war rally of the fall of 2001. Interestingly, the war rally lasted for about three months before succumbing to a double top that, if the comparisons turned out to be valid, could similarly allow for a July-August rally that spills into September -- and into the often-ominous, autumn earnings announcement season -- before what might be a full-fledged resumption of a full-fledged bear market. |
Technical Writer for Technical Analysis of STOCKS & COMMODITIES magazine, Working-Money.com, and Traders.com Advantage.
| Title: | Technical Writer |
| Company: | Technical Analysis, Inc. |
| Address: | 4757 California Avenue SW |
| Seattle, WA 98116 | |
| Phone # for sales: | 206 938 0570 |
| Fax: | 206 938 1307 |
| Website: | www.Traders.com |
| E-mail address: | DPenn@traders.com |
Traders' Resource Links | |
| Charting the Stock Market: The Wyckoff Method -- Books | |
| Working-Money.com -- Online Trading Services | |
| Traders.com Advantage -- Online Trading Services | |
| Technical Analysis of Stocks & Commodities -- Publications and Newsletters | |
| Working Money, at Working-Money.com -- Publications and Newsletters | |
| Traders.com Advantage -- Publications and Newsletters | |
| Professional Traders Starter Kit -- Software | |
Click here for more information about our publications!
Comments
Date: 07/03/02Rank: 4Comment: I too have seen this H S developing, but it is a complex H S having multiple shoulders, and the inner pattern seems to have pointed to a downside of 989, which alas we have broken. The other thing that you don t take into account is volume. Shouldn t the biggest volume occur in the left shoulder in the classic valid H S pattern? The H S you describe has more volume in the right shoulder leading one to think that it may not resolve itself in a text book manner...
Regards,
Elliot M. Simon
ems779@aol.com
Subscriber
Date: 07/08/02Rank: 5Comment:
Date: 07/23/02Rank: 5Comment: Great information, Thanks....

|

Request Information From Our Sponsors
- VectorVest, Inc.
- Executive Premier Workshop
- One-Day Options Course
- OptionsPro
- Retirement Income Workshop
- Sure-Fire Trading Systems (VectorVest, Inc.)
- Trading as a Business Workshop
- VectorVest 7 EOD
- VectorVest 7 RealTime/IntraDay
- VectorVest AutoTester
- VectorVest Educational Services
- VectorVest OnLine
- VectorVest Options Analyzer
- VectorVest ProGraphics v6.0
- VectorVest ProTrader 7
- VectorVest RealTime Derby Tool
- VectorVest Simulator
- VectorVest Variator
- VectorVest Watchdog
- StockCharts.com, Inc.
- Candle Patterns
- Candlestick Charting Explained
- Intermarket Technical Analysis
- John Murphy on Chart Analysis
- John Murphy's Chart Pattern Recognition
- John Murphy's Market Message
- MurphyExplainsMarketAnalysis-Intermarket Analysis
- MurphyExplainsMarketAnalysis-Visual Analysis
- StockCharts.com
- Technical Analysis of the Financial Markets
- The Visual Investor
