HOT TOPICS LIST
- MACD
- Fibonacci
- RSI
- Gann
- ADXR
- Stochastics
- Volume
- Triangles
- Futures
- Cycles
- Volatility
- ZIGZAG
- MESA
- Retracement
- Aroon
INDICATORS LIST
LIST OF TOPICS
PRINT THIS ARTICLE
by David Penn
There may still be room for a rally--if only before the next big ride down.
Position: N/A
David Penn
Technical Writer for Technical Analysis of STOCKS & COMMODITIES magazine, Working-Money.com, and Traders.com Advantage.
PRINT THIS ARTICLE
ELLIOTT WAVE
Elliott Wave and August Advances
08/13/02 02:18:19 PMby David Penn
There may still be room for a rally--if only before the next big ride down.
Position: N/A
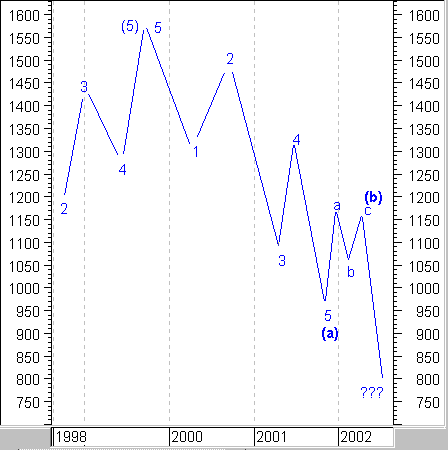
| In many ways, learning about Elliott wave analysis is like dating someone smarter than you. At some point in the courtship, you can't help but be amazed at what you find yourself agreeing with--so potent is the mix of emotional and intellectual attraction. Reviewing Robert Prechter's Elliott wave analysis of the September 11th-related market crash and subsequent rally in his new book, Conquer the Crash, I found it relatively straightforward to plot the (3) (4) (5) from trough to rally to crash from March to late May to September 2001, as well as the following (a) (b) (c) distribution period of January to February to March 2002 that appears to have followed. There is even the appearance of an (1) intermediate low being formed during the July "corporate crooks" low. |
| To this point, the behavior of the secular bear market in the S&P 500 has fallen into line with what Elliott wave theory suggests will happen at a primary wave top (the number five circled below). |

|
| Figure 1. Above is the last primary wave of an idealized Elliott wave cycle, showing the end of the third "fifth" of the upward "impulse" wave part of the market cycle, including the top at the end of primary wave 5 and the first "fifth" of the downward "correction" wave. |
| Graphic provided by: MetaStock. |
| |
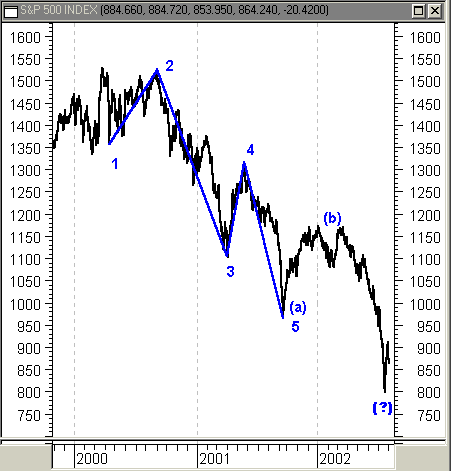
It looks increasingly likely that a move from the intermediate low at (1) back to an intermediate rally peak at a point (2)--not shown--will take place in the August-September period. This (2) rally peak is likely to be between 1120 and 1050 on the S&P 500, failing a test of year-to-date highs, but nonetheless making a strong countertrend rally, as much as 45% from the July lows near 770. At its close on Friday, August 2nd, the S&P 500 traded at 865, which suggests that a return on any countertrend rally might be anywhere from 20% to 30% before peaking out. Figure 2. The bear market of 2000-2002, with Elliott wave points included. Will (1) mark a significant low? The price action in recent weeks also provides an opportunity for even more cautious investors and traders who are looking to exploit what appears to be the second of two corrective "fifths," finishing off the complete Elliott wave market cycle. Recall that a complete Elliot wave market cycle features three five-wave movements ("impulse") twice interrupted by a-b-c corrections, followed by two five-wave movements ("correction") with one a-b-c correction separating them. As such, the bear market that commenced with the March 2000 top began the first five five-wave correction--in this case on the downside. The wave points of that five-wave movement are as follows: |
| 1. The April 2000 low from the all-time highs of the previous month. 2. The August 2000 high and the test of the all-time highs of March 2000. 3. The March 2001 low. The first major downleg of the bear market. 4. The May 2001 high. The "spring rally" and first bear market rally. 5. The September 2001 low. A slow market retreat turns into a rout when terrorists strike the U.S. (?) The July 2002 low. The "corporate responsibility" low. Congress gets tough on corporate criminals and the markets run for cover until Congress (and the President) go on vacation. |
| Again, this sets up the opportunity for a rally in the S&P 500 over the next month or two. It should be emphasized that such a rally would be countertrend, but as has been the case in previous countertrend rallies from April to August 2000, March to May 2001, and September to December 2001, the returns can be rewarding when pursued aggressively (14%, 23%, and 25% respectively). I have thought for some time that many traders were too put off by the complexity of Elliott wave analysis to be able to take advantage of some of its more rudimentary tenets. (Hopefully, Prechter's new book will encourage a new generation of EW practioners.) This need not be so. Paul Tudor Jones, in an interview for Jack Schwager's "Market Wizards" series, points to Elliott wave theory, suggesting that because EW "allows one to create incredibly favorable risk/reward opportunities" he attributes a great deal of his own trading success to what he calls the "Elliott Wave approach." For me it appears that part of the vitality of even the most rudimentary Elliott wave theory is how it presents simultaneously a sense of both long-term trend and short-term sentiment ("overbought" versus "oversold"). In the present case, a bet on an August rally in stocks could be merely the prelude to an even bigger bet against stocks in the October time frame. |
Technical Writer for Technical Analysis of STOCKS & COMMODITIES magazine, Working-Money.com, and Traders.com Advantage.
| Title: | Technical Writer |
| Company: | Technical Analysis, Inc. |
| Address: | 4757 California Avenue SW |
| Seattle, WA 98116 | |
| Phone # for sales: | 206 938 0570 |
| Fax: | 206 938 1307 |
| Website: | www.Traders.com |
| E-mail address: | DPenn@traders.com |
Traders' Resource Links | |
| Charting the Stock Market: The Wyckoff Method -- Books | |
| Working-Money.com -- Online Trading Services | |
| Traders.com Advantage -- Online Trading Services | |
| Technical Analysis of Stocks & Commodities -- Publications and Newsletters | |
| Working Money, at Working-Money.com -- Publications and Newsletters | |
| Traders.com Advantage -- Publications and Newsletters | |
| Professional Traders Starter Kit -- Software | |
Click here for more information about our publications!
Comments
Date: 08/18/02Rank: 4Comment: I am new to these ideas and i liked this article. I don t think it can ever be made too simple.

Request Information From Our Sponsors
- StockCharts.com, Inc.
- Candle Patterns
- Candlestick Charting Explained
- Intermarket Technical Analysis
- John Murphy on Chart Analysis
- John Murphy's Chart Pattern Recognition
- John Murphy's Market Message
- MurphyExplainsMarketAnalysis-Intermarket Analysis
- MurphyExplainsMarketAnalysis-Visual Analysis
- StockCharts.com
- Technical Analysis of the Financial Markets
- The Visual Investor
- VectorVest, Inc.
- Executive Premier Workshop
- One-Day Options Course
- OptionsPro
- Retirement Income Workshop
- Sure-Fire Trading Systems (VectorVest, Inc.)
- Trading as a Business Workshop
- VectorVest 7 EOD
- VectorVest 7 RealTime/IntraDay
- VectorVest AutoTester
- VectorVest Educational Services
- VectorVest OnLine
- VectorVest Options Analyzer
- VectorVest ProGraphics v6.0
- VectorVest ProTrader 7
- VectorVest RealTime Derby Tool
- VectorVest Simulator
- VectorVest Variator
- VectorVest Watchdog
