HOT TOPICS LIST
- MACD
- Fibonacci
- RSI
- Gann
- ADXR
- Stochastics
- Volume
- Triangles
- Futures
- Cycles
- Volatility
- ZIGZAG
- MESA
- Retracement
- Aroon
INDICATORS LIST
LIST OF TOPICS
PRINT THIS ARTICLE
by Andrew Hetherington
A recent island reversal pattern on the QQQ index raises a flag of caution.
Position: N/A
Andrew Hetherington
Classic Dow Theorist who trades as a pure technician, using pattern recognition.
PRINT THIS ARTICLE
ISLAND REVERSAL
Island Reversal Patterns -- Will the Triple Q's Drop?
04/23/02 11:28:22 AMby Andrew Hetherington
A recent island reversal pattern on the QQQ index raises a flag of caution.
Position: N/A
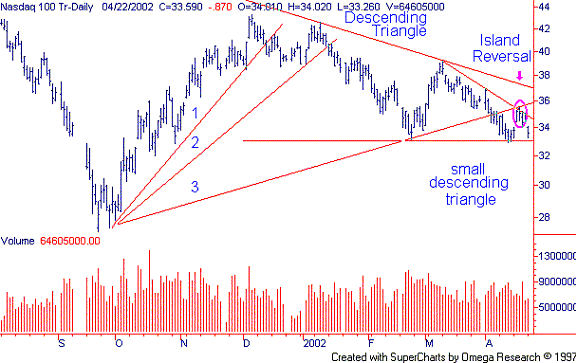
| Many can recall my prognosticating the indices to drop from my article titled "A change in market direction" from February 15. The head and shoulders pattern on the Nasdaq has become part of a descending triangle which is 5-months in length. This larger triangle also has a small 2-month descending triangle within it. The volume on the pattern is by no means perfect, however, it must be taken seriously. I've adjusted my third fan line as is sometimes necessary when you are trying to anticipate a top or bottom. This new placement of my third fan line clearly shows a break out and a throwback to your sell short position in the $35.50 area. |
| In addition, there is an island reversal, which completed today by breaking on the downside. As I've mentioned in a previous article titled "Island Reversals" they are not of major trend implication. However, this event needs to be taken seriously. These are not a common pattern in the index. |

|
| Figure 1: Daily chart for the Nasdaq 100. |
| Graphic provided by: SuperCharts. |
| |
| If the $33.00 line does not hold then we will see $31.00 on the chart. Some may scoff at this as a very small trend. However, if traded at the correct time it can be very profitable. A drop from $35.50 to the $31.00 area on the option price is a potential quadruple. If some are leery of options then trade the equity as an alternative and see a profit of possibly 13% in a short period of time. Naturally, a buy stop is necessary to cover your short position if it goes in the direction you had not anticipated. The appropriate placement for the buy stop would have been just above the third fan line in the $36.00 area. |
| I suggest you watch the $33.00 line and if it doesn't break take your profits off of the table. However, it looks very weak and ready to drop and I believe patience will be rewarded on the downside. |
Classic Dow Theorist who trades as a pure technician, using pattern recognition.
| Toronto, Canada |
Click here for more information about our publications!
PRINT THIS ARTICLE

|

Request Information From Our Sponsors
- StockCharts.com, Inc.
- Candle Patterns
- Candlestick Charting Explained
- Intermarket Technical Analysis
- John Murphy on Chart Analysis
- John Murphy's Chart Pattern Recognition
- John Murphy's Market Message
- MurphyExplainsMarketAnalysis-Intermarket Analysis
- MurphyExplainsMarketAnalysis-Visual Analysis
- StockCharts.com
- Technical Analysis of the Financial Markets
- The Visual Investor
- VectorVest, Inc.
- Executive Premier Workshop
- One-Day Options Course
- OptionsPro
- Retirement Income Workshop
- Sure-Fire Trading Systems (VectorVest, Inc.)
- Trading as a Business Workshop
- VectorVest 7 EOD
- VectorVest 7 RealTime/IntraDay
- VectorVest AutoTester
- VectorVest Educational Services
- VectorVest OnLine
- VectorVest Options Analyzer
- VectorVest ProGraphics v6.0
- VectorVest ProTrader 7
- VectorVest RealTime Derby Tool
- VectorVest Simulator
- VectorVest Variator
- VectorVest Watchdog
