HOT TOPICS LIST
- MACD
- Fibonacci
- RSI
- Gann
- ADXR
- Stochastics
- Volume
- Triangles
- Futures
- Cycles
- Volatility
- ZIGZAG
- MESA
- Retracement
- Aroon
INDICATORS LIST
LIST OF TOPICS
PRINT THIS ARTICLE
by Andrew Hetherington
The market is now making its eighth change in direction in 23 months. It is heading down for a short while, and this will be the time to take your long positions.
Position: N/A
Andrew Hetherington
Classic Dow Theorist who trades as a pure technician, using pattern recognition.
PRINT THIS ARTICLE
CHART ANALYSIS
A Change in Market Direction
02/20/02 08:33:15 AMby Andrew Hetherington
The market is now making its eighth change in direction in 23 months. It is heading down for a short while, and this will be the time to take your long positions.
Position: N/A
| In another recent article regarding the networking sector I illustrated how many in this sector had similar head and shoulder patterns. On this dip down it will be the completion of the right shoulder, or at least the one side of the shoulder. When they bottom out on this dip it will be the time to take your long positions and hold them. It looks as if most of those will drop towards the base of the heads, or even slightly lower. Remember, the necklines are all on quite a slope and going slightly below some of the heads is possible. Watch the volume and you'll see the correct time to take a position. |
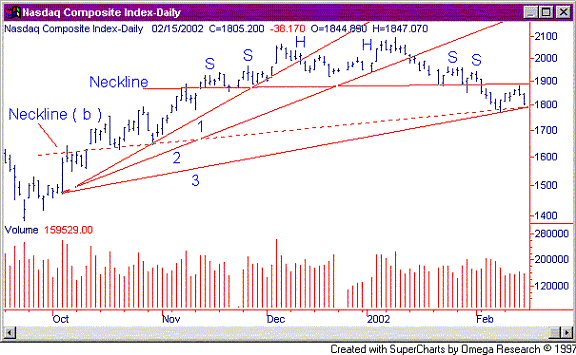
| This change in direction seems to be following a standard course. The Nasdaq (Figure 1) is about to break the third fan line at 1800 to change its temporary direction. It has completed an awkward head and shoulders pattern by breaking on the downside and having a pullback, which pretty much ended on Friday February 15, 2002. Now it will drop towards the support in the 1550 - 1650 area. It could even drop as low as the September low of 1387 but I doubt it will go this low. I think a strong strategy is to take positions 1/3 at a time on the way down until you have dollar cost averaged your position without having to pick the exact bottom. This is extremely difficult to do even for the most seasoned technician. Take positions based on your support and resistance areas on the indices as well as the individual equities. Some will look at the index and see a rounding top. This is also there within the larger head and shoulders pattern. So, we have a 1-year head and shoulders pattern, with a small head and shoulders and a triangle on the left shoulder and the head. Then we have a 5-month rounding top or head and shoulders on the head and right shoulder. As always it is patterns within patterns. Furthermore, there could also be another head and shoulders finishing where I've placed my dotted neckline. |

|
| Figure 1: Daily chart for the Nasdaq Composite Index. |
| Graphic provided by: SuperCharts. |
| |
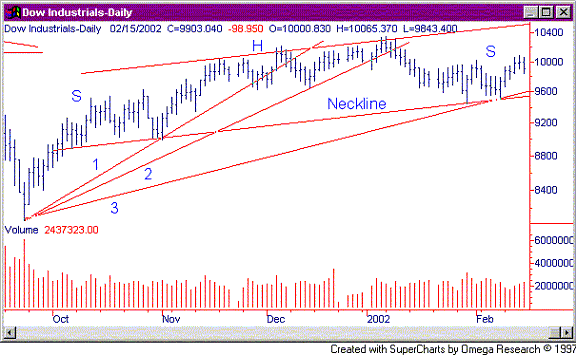
| On the Dow (Figure 2) we have a similar story with a complex head and shoulders pattern or even a rounding top and/or a broadening top. The third fan line will break in the 9600 area. The Nasdaq is slightly ahead but both are operating synchronously for the most part. Take note how the volume has picked up slightly the past couple of trading sessions. Expect this to continue. Prognosticating the Dow to drop to the 9050 area is a combination of support lines including the 20-year trend. Naturally it could go lower but this will be an initial target, keeping in mind the underlying strength in defensive equities like Phillip Morris and Eastman Kodak. |
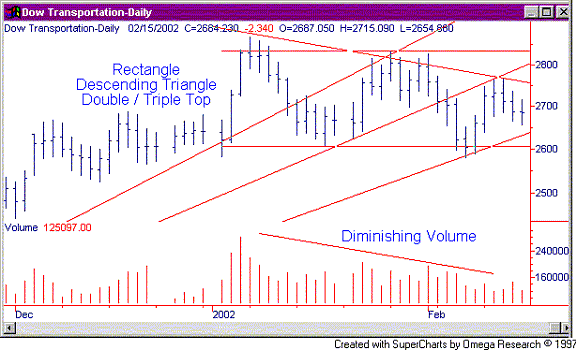
 Figure 2: Daily chart for Dow Industrials. The Dow Transports (Figure 3) will confirm all this with the breaking of the third fan line in the 2650 area. It currently has a descending triangle, rectangle, and/or a double or triple top. All of these patterns are accurate. The downside break will come in the 2600 area. The early warning from the fan line helps make this decision easier. Taking a short on the Transportation Index is a smart choice since it's fairly close to the top end of the patterns and it has a laggard tendency. |
 Figure 3: Daily chart for Dow Transports. If you are not a short-term speculator and have a medium to long-term time horizon then this won't affect you as much. However, a 10% drop on the Dow and a 15% drop on the Nasdaq is significant and must be considered. |
Classic Dow Theorist who trades as a pure technician, using pattern recognition.
| Toronto, Canada |
Click here for more information about our publications!
Comments
Date: 02/20/02Rank: 5Comment:
Date: 02/22/02Rank: Comment: Nice work thanks!!
Date: 02/22/02Rank: 5Comment: Good!
Date: 02/26/02Rank: 4Comment:
Date: 03/11/02Rank: 4Comment:

|

Request Information From Our Sponsors
- StockCharts.com, Inc.
- Candle Patterns
- Candlestick Charting Explained
- Intermarket Technical Analysis
- John Murphy on Chart Analysis
- John Murphy's Chart Pattern Recognition
- John Murphy's Market Message
- MurphyExplainsMarketAnalysis-Intermarket Analysis
- MurphyExplainsMarketAnalysis-Visual Analysis
- StockCharts.com
- Technical Analysis of the Financial Markets
- The Visual Investor
- VectorVest, Inc.
- Executive Premier Workshop
- One-Day Options Course
- OptionsPro
- Retirement Income Workshop
- Sure-Fire Trading Systems (VectorVest, Inc.)
- Trading as a Business Workshop
- VectorVest 7 EOD
- VectorVest 7 RealTime/IntraDay
- VectorVest AutoTester
- VectorVest Educational Services
- VectorVest OnLine
- VectorVest Options Analyzer
- VectorVest ProGraphics v6.0
- VectorVest ProTrader 7
- VectorVest RealTime Derby Tool
- VectorVest Simulator
- VectorVest Variator
- VectorVest Watchdog
