HOT TOPICS LIST
- MACD
- Fibonacci
- RSI
- Gann
- ADXR
- Stochastics
- Volume
- Triangles
- Futures
- Cycles
- Volatility
- ZIGZAG
- MESA
- Retracement
- Aroon
INDICATORS LIST
LIST OF TOPICS
PRINT THIS ARTICLE
by Andrew Hetherington
Every now and again you see this style of pattern, an Island Reversal. Although, it is not a major reversal pattern it does have temporary trend implications that can be profitable for trading.
Position: N/A
Andrew Hetherington
Classic Dow Theorist who trades as a pure technician, using pattern recognition.
PRINT THIS ARTICLE
ISLAND REVERSAL
Island Reversals
03/13/02 08:43:13 AMby Andrew Hetherington
Every now and again you see this style of pattern, an Island Reversal. Although, it is not a major reversal pattern it does have temporary trend implications that can be profitable for trading.
Position: N/A
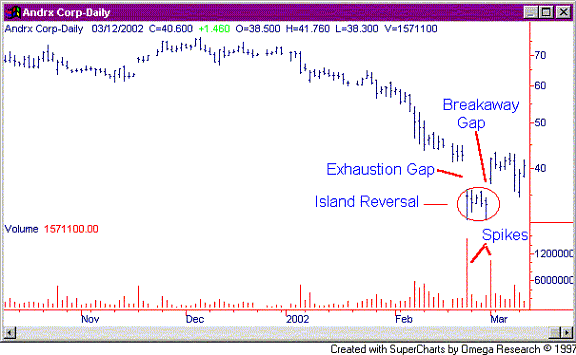
| The important point to remember when trading this pattern is to be nimble. The trend can change quickly. These are created by gaps, so volatility is prevalent. Many technicians discuss gaps but aren't able to correctly identify them. In this example in Figure 1 we have an exhaustion gap on the downside. Then it consolidates for 5 days before having a breakaway gap on the upside thus creating the island. |
| The first gap is the exhaustion gap. We see ADRX bottom out with a huge spike of almost 16 million shares, while closing at $34.90 way off of the bottom that day at $31.13. This gave every indication that the bottom was in. |

|
| Figure 1: Daily chart for ADRX. |
| Graphic provided by: SuperCharts. |
| |
| Over the next four days we see a return move near the bottom with a slight increase in volume on the fourth day. This early warning combined with underlying strength from a few days earlier gave the indication to jump in near this bottom. Placing a stop loss slightly below the bottom of $31.13 at approximately the $30.75 area would be a limited downside proposition. |
| The anticipated move is to retrace the entire previous very short-term move prior to the drop. This would be in the $45.00 area. Naturally, exuberance could make it go higher but this would be a fairly safe plan to keep in mind when trying these out. |
| It has retraced the anticipated amount reaching $43.35 a few days later and if volume comes in much higher then it will rise even further. However, I would caution anyone interested that the volume will be the key if you have already missed the boat. I would be looking for 6-8 million shares on any one day for it to move higher. In addition to this, since the boat has left the port I would pass on it even if there were profit potential since our buy point was in the low to mid $30.00 area. |
Classic Dow Theorist who trades as a pure technician, using pattern recognition.
| Toronto, Canada |
Click here for more information about our publications!
Comments
Date: 03/19/02Rank: 3Comment:
Date: 03/19/02Rank: 4Comment: VERY EDUCATIONAL
AH HA
THANKS
STEVE
Date: 12/13/02Rank: 4Comment:

Request Information From Our Sponsors
- StockCharts.com, Inc.
- Candle Patterns
- Candlestick Charting Explained
- Intermarket Technical Analysis
- John Murphy on Chart Analysis
- John Murphy's Chart Pattern Recognition
- John Murphy's Market Message
- MurphyExplainsMarketAnalysis-Intermarket Analysis
- MurphyExplainsMarketAnalysis-Visual Analysis
- StockCharts.com
- Technical Analysis of the Financial Markets
- The Visual Investor
- VectorVest, Inc.
- Executive Premier Workshop
- One-Day Options Course
- OptionsPro
- Retirement Income Workshop
- Sure-Fire Trading Systems (VectorVest, Inc.)
- Trading as a Business Workshop
- VectorVest 7 EOD
- VectorVest 7 RealTime/IntraDay
- VectorVest AutoTester
- VectorVest Educational Services
- VectorVest OnLine
- VectorVest Options Analyzer
- VectorVest ProGraphics v6.0
- VectorVest ProTrader 7
- VectorVest RealTime Derby Tool
- VectorVest Simulator
- VectorVest Variator
- VectorVest Watchdog
