HOT TOPICS LIST
- MACD
- Fibonacci
- RSI
- Gann
- ADXR
- Stochastics
- Volume
- Triangles
- Futures
- Cycles
- Volatility
- ZIGZAG
- MESA
- Retracement
- Aroon
INDICATORS LIST
LIST OF TOPICS
PRINT THIS ARTICLE
by Dennis D. Peterson
Spreadsheets and formulas.
Position: N/A
Dennis D. Peterson
Market index trading on a daily basis.
PRINT THIS ARTICLE
SWING CHART
Swing Prediction (Part III of III)
11/19/01 04:23:17 PMby Dennis D. Peterson
Spreadsheets and formulas.
Position: N/A
| Part I... Part II... Part III |
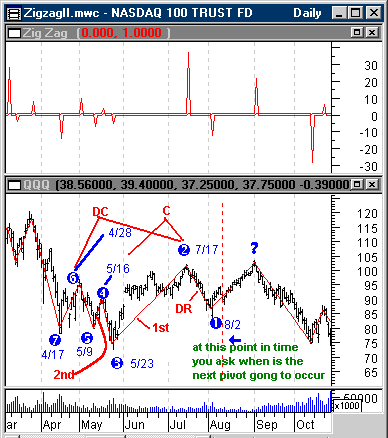
| The upper chart of Figure 3 (for ease of reference I've repeated it here from Part II) is the swing count the day after a swing occurs. |

|
| Figure 3: Bars Per Swing (top chart) and Daily QQQ (bottom chart). Top chart is an indicator that shows on the positive side how many bars have just been spent in an upswing and on the negative side how many bars have been spent on the downside. The bottom chart is daily QQQ price for 2000. The circled numbers are the pivots that are used to define the swings that will be used for predicting when ? will occur. |
| Graphic provided by: MetaStock. |
| Graphic provided by: Data vendor: eSignal<. |
| |
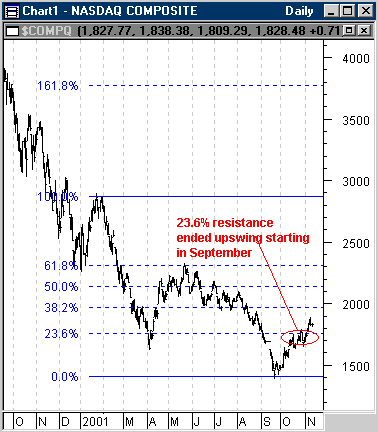
| You can see a bunch of small swings along with some much stronger ones. I choose to make my calculations go for the swing at 8/31 because it was a period of time that had strong swings preceding it. Small swings, I would argue, don't influence as much as they confirm and what you want is something that has the potential for strong influence. That is, in a strong swing I expect the first rally or reaction to be a counter swing short in duration, and this only confirms that the trend is intact. This is in keeping with Figures 1 and 2 from Part I which are the basis for this expectation. The question is what do you expect would be the most likely pattern? The Metastock formula I used was pctg:=Input("ZigZag Percentage",3,20,8); cond1:=Zig(C,pctg,%) < Ref(Zig(C,pctg,%),-1); cond2:=Zig(C,pctg,%) > Ref(Zig(C,pctg,%),-1); diff1:=BarsSince(cond1){no of days since a down swing}; diff2:=-BarsSince(cond2);{no of days since an up swing} sumdiff1:=0;sumdiff2:=0; sumdiff1:=If(diff1>0,1,Ref(diff1,-1)); sumdiff2:=If(diff2<0,1,Ref(diff2,-1)); sumdiff1;sumdiff2 Maybe going for the mid-October swing point would have been better, but then curiously enough, 10/16 does come up as the first alternative using a ratio of 1.732. I have a second preference and that is to switch the ratios when I apply them to an upswing versus a downswing. Normally you might attach a Fibonacci 0% retracement at a peak and go down to see where 100% retracement ends. But you could also start at the bottom with 0% and go up. Looking at the Nasdaq composite it is clear the upswing stalled at 23.8% going back up (Figure 4). |
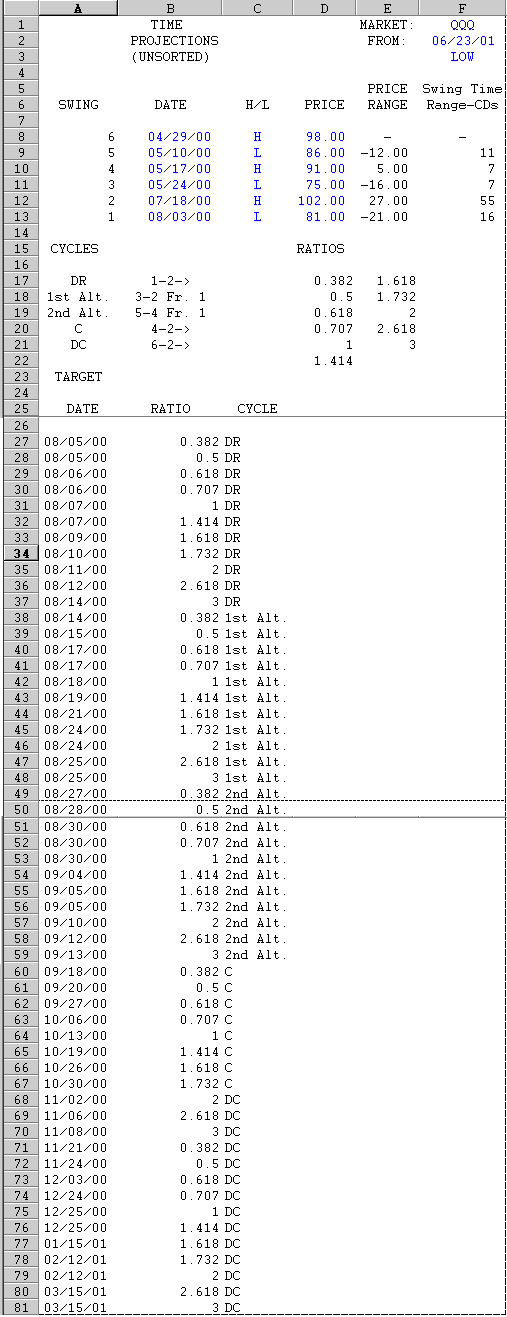
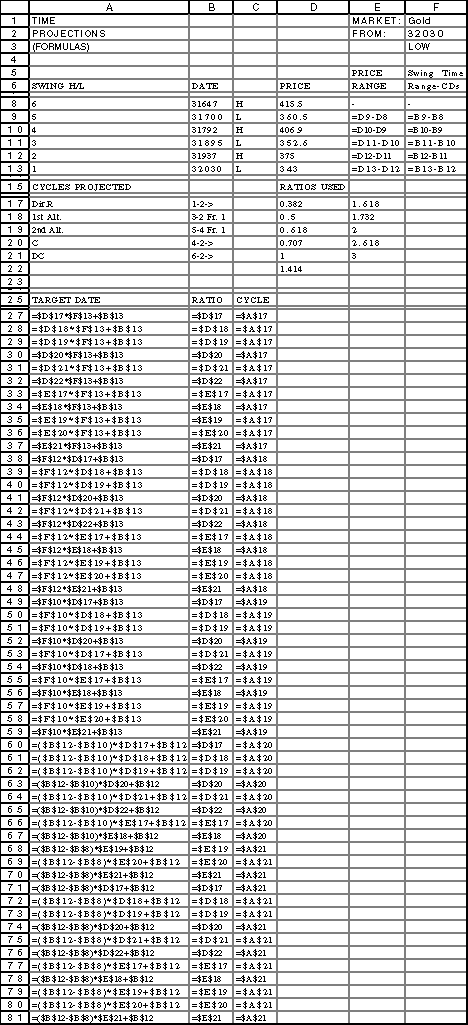
 Figure 4: Daily Nasdaq Composite. Resistance was encountered at the 23.6% retracement percentage suggesting that 23.6% is a ratio that wants to be considered in forward projections. So where is 23.8% in the calculations? It isn't anywhere. So I would add it to the ratios, but I would have a separate set of ratios for calculating the next high versus the next low. Finally I would put a threshold on what pivots I would consider. I would start by throwing out all swings of less than five bars and go from there. When you see the dates created in Part II you will probably blink. It's a bunch. Somehow, even if you are looking for clusters of dates, seeing practically every day of the month seems like overkill and clustering is going to be more subjective than objective. With further analysis and trials I think this approach could bear some profitable results. If you look at the first four dates of my notepad's manual calculations they all turn out to be interesting and all I did was apply a little filtering. Here is the spreadsheet with the results. The spreadsheet will calculate just about every combination of cycle (see B17 through B21for text description, using the corresponding calculations in F9 through F13) times the ratios (D17 through D21 and E17 through E21) added to two dates (B13 and B12). What you see in rows 17 through 21 are the primary candidates, and you will recognize as the manual calculations I did for the notepad capture in Part I. The sheet (Figure 5) is sorted by date, column A rows 27 through 81, to see clusters, but recognize that I left column B unsorted so the labels are wrong.  What you can see is that there is a lot of clustering, not only does 8/30 come up, but so does 8/17.  Figure 6: Excel spreadsheet for creating dates. |
| Part I... Part II... Part III |
Market index trading on a daily basis.
| Title: | Staff Writer |
| Company: | Technical Analysis, Inc. |
| Address: | 4757 California Ave SW |
| Seattle, WA 98116-4499 | |
| Phone # for sales: | 206 938 0570 |
| Fax: | 206 938 1307 |
| Website: | www.traders.com |
| E-mail address: | dpeterson@traders.com |
Traders' Resource Links | |
| Charting the Stock Market: The Wyckoff Method -- Books | |
| Working-Money.com -- Online Trading Services | |
| Traders.com Advantage -- Online Trading Services | |
| Technical Analysis of Stocks & Commodities -- Publications and Newsletters | |
| Working Money, at Working-Money.com -- Publications and Newsletters | |
| Traders.com Advantage -- Publications and Newsletters | |
| Professional Traders Starter Kit -- Software | |
Click here for more information about our publications!
Comments
Date: 11/20/01Rank: 4Comment:
Date: 11/26/01Rank: 5Comment:
Date: 11/27/01Rank: 2Comment:
Date: 05/15/02Rank: 5Comment:

Request Information From Our Sponsors
- StockCharts.com, Inc.
- Candle Patterns
- Candlestick Charting Explained
- Intermarket Technical Analysis
- John Murphy on Chart Analysis
- John Murphy's Chart Pattern Recognition
- John Murphy's Market Message
- MurphyExplainsMarketAnalysis-Intermarket Analysis
- MurphyExplainsMarketAnalysis-Visual Analysis
- StockCharts.com
- Technical Analysis of the Financial Markets
- The Visual Investor
- VectorVest, Inc.
- Executive Premier Workshop
- One-Day Options Course
- OptionsPro
- Retirement Income Workshop
- Sure-Fire Trading Systems (VectorVest, Inc.)
- Trading as a Business Workshop
- VectorVest 7 EOD
- VectorVest 7 RealTime/IntraDay
- VectorVest AutoTester
- VectorVest Educational Services
- VectorVest OnLine
- VectorVest Options Analyzer
- VectorVest ProGraphics v6.0
- VectorVest ProTrader 7
- VectorVest RealTime Derby Tool
- VectorVest Simulator
- VectorVest Variator
- VectorVest Watchdog
