HOT TOPICS LIST
- MACD
- Fibonacci
- RSI
- Gann
- ADXR
- Stochastics
- Volume
- Triangles
- Futures
- Cycles
- Volatility
- ZIGZAG
- MESA
- Retracement
- Aroon
INDICATORS LIST
LIST OF TOPICS
PRINT THIS ARTICLE
by Dennis D. Peterson
What is this indicator? Does it work? Something new or just a different look at what you might have already observed?
Position: N/A
Dennis D. Peterson
Market index trading on a daily basis.
PRINT THIS ARTICLE
BULL/BEAR MARKET
Balance of Market Power (Part III of III)
08/23/01 11:20:03 AMby Dennis D. Peterson
What is this indicator? Does it work? Something new or just a different look at what you might have already observed?
Position: N/A
| From the previous two parts it can be seen that using BMP as a setup has problems. When you look at Figures 3 and 4 (Part II of III) you can see that there are a lot of trades during the gradual increase of AOL. Figure 4 is worse because I allowed the exit to occur on a frequent event, today's open < yesterday's close, while allowing entry on a frequent event , BMP > threshold - more than you should need and certainly more than you want. From Part II, two events (November 8 and December 5 := event D of Figure 2 part II) did seem to be effective in determining an upswing and a downswing. The characteristic of those two events is high low range. The distinguishing characteristic is the range covered by either of these two events in relation to the range immediately preceding them. Knowing about Bollinger band squeezes and that the market contracts and expands in volatility further suggests that this could be a fruitful path. I can add a simple range test by calculating a typical range as a 5-day simple moving average of high-low and asking is the range of a BMP event greater than the typical range. Bollinger would suggest 1.5 using standard deviations, and it will be interesting to see what happens. |
| If I add a range test to long entry of: typical range = 5-day simple moving average of high - low, todays range test = yesterday's [(high-low)>opt3 times typical range], letting opt3 range through the values of 1 to 4 in increments of .2, and keeping the other two entry conditions, namely today's open>yesterday's close and yesterday's BMP>opt1 (yesterday's (C-O)/(H-L)>threshold), I have an entry condition that should work. My setup is to have a BMP event yesterday that has a high low range greater than recent history, with entry for today being, today's open is greater than yesterday's close. My problem is to exit fast enough and after many attempts using linear regression slope, volume patterns and other devices along with BMP, nothing worked nearly as well as using BMP<-opt2, or that (C-O)/(H-L) < threshold. In fact I tried over a dozen combinations focused on exit, with some tweaking on the entry side. |

|
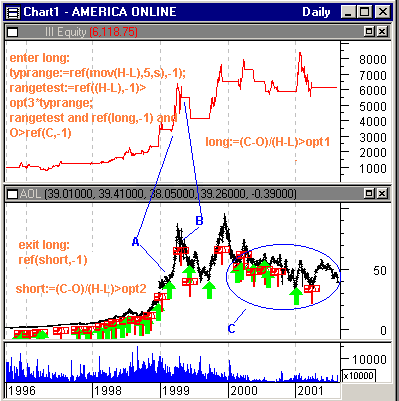
| Figure 1: AOL daily price and volume (bottom two charts) and $1,000 equity performance (top chart) using Metastock formula’s overlayed on two top charts. |
| Graphic provided by: MetaStock. |
| Graphic provided by: Data vendor: eSignal<. |
| |
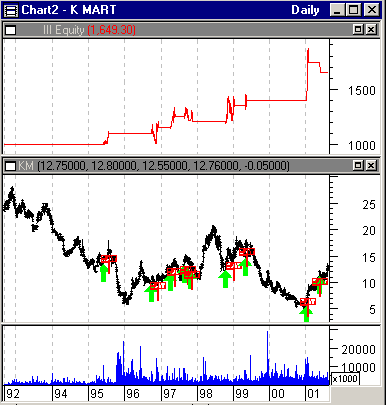
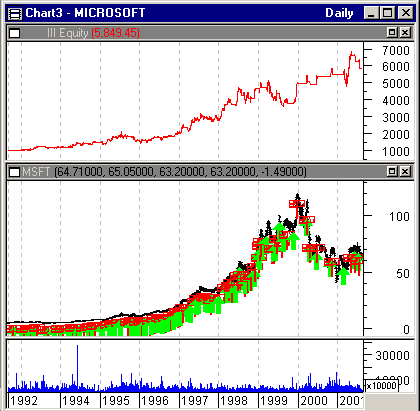
| The system, as you might expect, does well on the upside as evidenced by some timely entries and almost timely exits (Figure 1: A and B). Using BMP for the downside is a losing cause. What's even worse is to move sideways (Figure 1: area C), as seen by the equity performance stalling. The system optimization ended with opt1=.75, i.e. that BMP >.75 for entry setup, opt3 = 1.2, i.e. that the BMP range be 1.2 times greater than the 5-day simple moving average range, and that opt2=.71, i.e. that BMP<-.71 for exit. Is BMP tradable? One clue lies in the bull and bear traps (if you remember them). What a bear trap looks like is a sudden move up enhanced by causing stop losses for shorts to be executed. Bull traps are down moves enhanced by causing stop losses for longs to be executed (see 12/20/2000 posting "Nasdaq, Pivot Points and Stops"). Traps can have high low ranges that are greater than recent, i.e. past five days, ranges. They don't mark a reversal. For BMP they are a false event. You would now need to enhance the trading rules to avoid traps. Ironic. What happens if I pick two other stocks? Kmart should be interesting because it is mostly negative and Microsoft because it has a better overall uptrend than AOL. The good, the bad, and the ugly.  Figure 2: Kmart daily price and volume history (bottom two charts) and $1,000 equity performance (top chart). |
Given that Kmart was at $25 per share in '92 and is currently at $13 per share the system did well. Right? There's a peak in '98 that got missed - not so good. Shorting Kmart with BMP would be exciting since many of the upswings are missed. The values for opt1, opt2, and opt3 are .65, .65, and 1.8 respectively. A bit different than AOL... hmm. Figure 3: Microsoft daily price and volume history (bottom two charts) and $1,000 equity performance (top chart). |
| You can tell looking at the equity performance of Microsoft Corp. that the system kept you in from '92 through '98. This is exactly what you would expect because of BMP's upside performance. You lost on the downside again. The values for opt1, opt2, and opt3 are .65, .71, and 1.0 respectively. Summary: BMP changes so fast that it is better used as a short-term indicator than a long-term one. It has the problem that it can reach maximum values in one day. It doesn't show the raw data characteristics of an item suited for trend use. It is an event. But should a $1.00 change resulting in BMP equaling +1 or -1, be the same as the same as a $10 change resulting in +1 or -1? The range in change matters relative to the recent past history. So a $1.00 change could be as relevant as a $10.00 change. This fits with Bollinger band squeezes. BMP in fact fits better with candlestick engulfing patterns in terms of frequency and use. BMP events are more prevalent on the upside than on the downside. This means BMP could be used for entry and something else used for exit. This means that knowing if a stock is bullish or bearish is important and would help greatly with BMP. Using BMP events and not being aware of bull or bear traps is going to hurt because you could have false BMP events - another example of why stop losses are needed. In Part I, I mentioned that BMP had some promising virtues because it puts a value to the bullishness or bearishness of each day and doing so is analogous to A/D (Accumulation/Distribution). OBV also looks for bullish or bearish moves but does so by comparing the closes of adjacent days. A/D uses today's closes, highs and lows. The major difference is that one uses today's differences while the other uses differences between two consecutive days. Sometimes A/D and OBV agree by having the same trend, sometimes opposite, and sometimes one is flat while the other shows a trend. The most powerful use is when both agree. That's why I went to a setup based on BMP and range, but also wanted the next day's open higher than previous day's close. I wanted agreement. Finally, the range multiplier went from 1.8 for Kmart, a stock in an overall downtrend, to 1.2 for AOL a stock that has had a reasonable increase, to 1.0 for Microsoft a stock that has had a strong price increase over the years. This says that stocks in a downtrend need to have a strong signal for entry, while others can get by on much weaker ones. That is going to make BMP difficult to trade on it's own merits alone, but does provide a way to exercise caution. For that BMP works. Other parts to this series: Part I Part II |
Market index trading on a daily basis.
| Title: | Staff Writer |
| Company: | Technical Analysis, Inc. |
| Address: | 4757 California Ave SW |
| Seattle, WA 98116-4499 | |
| Phone # for sales: | 206 938 0570 |
| Fax: | 206 938 1307 |
| Website: | www.traders.com |
| E-mail address: | dpeterson@traders.com |
Traders' Resource Links | |
| Charting the Stock Market: The Wyckoff Method -- Books | |
| Working-Money.com -- Online Trading Services | |
| Traders.com Advantage -- Online Trading Services | |
| Technical Analysis of Stocks & Commodities -- Publications and Newsletters | |
| Working Money, at Working-Money.com -- Publications and Newsletters | |
| Traders.com Advantage -- Publications and Newsletters | |
| Professional Traders Starter Kit -- Software | |
Click here for more information about our publications!
Comments

Request Information From Our Sponsors
- StockCharts.com, Inc.
- Candle Patterns
- Candlestick Charting Explained
- Intermarket Technical Analysis
- John Murphy on Chart Analysis
- John Murphy's Chart Pattern Recognition
- John Murphy's Market Message
- MurphyExplainsMarketAnalysis-Intermarket Analysis
- MurphyExplainsMarketAnalysis-Visual Analysis
- StockCharts.com
- Technical Analysis of the Financial Markets
- The Visual Investor
- VectorVest, Inc.
- Executive Premier Workshop
- One-Day Options Course
- OptionsPro
- Retirement Income Workshop
- Sure-Fire Trading Systems (VectorVest, Inc.)
- Trading as a Business Workshop
- VectorVest 7 EOD
- VectorVest 7 RealTime/IntraDay
- VectorVest AutoTester
- VectorVest Educational Services
- VectorVest OnLine
- VectorVest Options Analyzer
- VectorVest ProGraphics v6.0
- VectorVest ProTrader 7
- VectorVest RealTime Derby Tool
- VectorVest Simulator
- VectorVest Variator
- VectorVest Watchdog
