HOT TOPICS LIST
- MACD
- Fibonacci
- RSI
- Gann
- ADXR
- Stochastics
- Volume
- Triangles
- Futures
- Cycles
- Volatility
- ZIGZAG
- MESA
- Retracement
- Aroon
INDICATORS LIST
LIST OF TOPICS
PRINT THIS ARTICLE
by Dennis D. Peterson
What is this indicator? Does it work? Something new or just a different look at what you might have already observed?
Position: N/A
Dennis D. Peterson
Market index trading on a daily basis.
PRINT THIS ARTICLE
BULL/BEAR MARKET
Balance of Market Power (Part I of III)
08/22/01 02:39:32 PMby Dennis D. Peterson
What is this indicator? Does it work? Something new or just a different look at what you might have already observed?
Position: N/A
| In the August issue of "Technical Analysis of Stocks and Commodities" magazine author Igor Livshin writes about an indicator that measures whether the bulls or the bears are in charge. I had seen an earlier copy of it, without pictures, and set it aside to look at another day because it was describing phenomenon that I have observed for a few years and could readily agree with. |
| Livshin's approach is to ask whether the bulls or bears prevailed during a trading day in comparison to today's range, that is, today's high minus today's low (high-low). Relative to this range the author asks how did the high and low compare to the open, and the close, and finally the close compared to the open. All three comparisons are added with equal weight to arrive at Livshin's balance of power. Livshin has renamed his indicator to be the Balance of Market Power (BMP) and I will use that acronym rather than the one used in his article. A reader pointed out that you could reduce Livshin's final equation to: BMP = (close-open)/(high-low). |

|
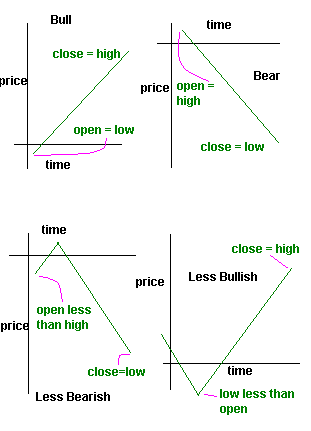
| Figure 1: Idealized intraday bullish and bearish price patterns. Top two charts are strongly bullish and bearish, while bottom two charts are less bullish and bearish. |
| |
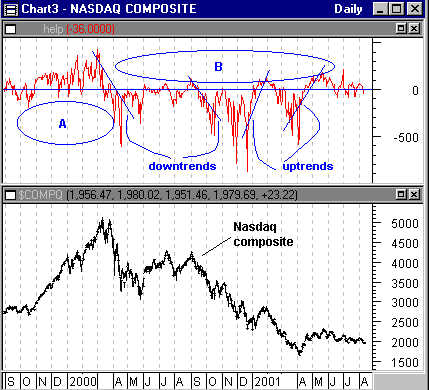
| So is the equation a useful trading indicator? Certainly the logic going into BMP is persuasive. For example, a bullish day occurs when price goes up from the open and never looks back, so that the open equals the low and close equals the high. This is consistent with what I have observed over the years and Figure 1 shows, an idealized view of one day's worth of intraday trading. In the top half of Figure 1 are charts that reflect a very strong bull or bear day. In the upper left chart since close = high, and open = low, BMP is (high-open)/(high-open) or a value of +1. In the upper right chart since close = low, and open = high, BMP is (open-high)/(high-open) or a value of -1. So a very strong bull day has a value of +1 and a bear day a value of -1. The price action with less bullish and bearish days is shown in the bottom two charts. The low often occurs about 1 to 1&1/2 hours after open and also the high. The resulting BMP values are less than +1 for a bullish move and greater than -1 for a bearish move because in each case close-open < high-low. And, this is consistent with the A/D (accumulation/distribution) indicator in accumulating the amount of volume in proportion to how today's close finished relative to today's range (high - low). So BMP does follow observation and the premise of other indicators, such as A/D. Moreover Livshin indirectly does an elegant job of rationalizing why so simple an equation as (close - open)/(high-low) actually incorporates all of the moves that the bulls or bears might make. Now the question is what kind of trading performance might you expect from BMP?  Figure 2: Nasdaq new highs minus new lows (top chart) and Nasdaq composite daily price (bottom chart). Graphic provided by: Metastock. Graphic provided by: Data vendor: eSignal. |
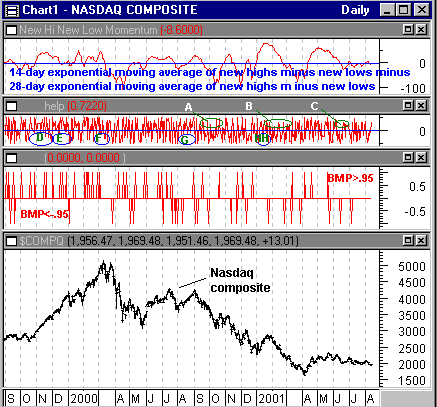
| An oscillator I use with Nasdaq equities is Nasdaq new highs minus new lows. New highs and lows are typical of what has enticed me to spend time on market breadth indicators. The difference, new highs-new lows, is seen in the upper chart of Figure 2. The first thing I noticed were the extreme values, but I knew there were ways to deal with the extremes because I noticed two other features. First, when the Nasdaq composite is moving up in a strong bull move, area A of the chart of new highs minus new lows has values predominantly positive. Conversely, when the Nasdaq composite was bearish (Figure 2: area B), the values were predominantly negative. Second, the trends of new highs minus new lows often matched the price trends of the Nasdaq composite. This had McClellan written all over it. What would you see if you charted BMP for a comparable period of time? The result is in Figure 3.  Figure 3: McClellan (top chart) like oscillator of news minus lows, BMP (second chart from top), BMP>.95 true is +1 and BMP <-.95 is -1 (third chart from top), and daily Nasdaq composite (bottom chart). |
| The top chart is a McClellan like oscillator and is the 14-day exponential moving average of new highs minus new lows minus the 28-day exponential moving average of new highs minus new lows. From the granularity of the chart, and I'll magnify it later, its hard to tell but the characteristics necessary for the basis of a reasonably performing indicator pay off with the McClellan like oscillator of new highs minus lows having tops and bottoms about where you want them. This demonstrates that if the raw data is reasonably well behaved you should be able to build an indicator that is also well behaved. Now look at BMP, the second chart from the top. I have identified areas A through H to correspond to like areas of new highs minus new lows of Figure 3. The difference is easily discernable. There are no predominant open areas. There are only small ones. Whereas, new highs minus lows had large open areas punctuated by crossings of the zero line, indicating small shifts in bullishness and bearishness, BMP is missing that behavior. But there is something else curious going on. The second chart from the bottom of Figure 3 plots the condition that when BMP >.95 is true show a +1 and if false a 0, and the condition that when BMP<-.95 is true show a -1 and if false a 0. Notice how the spacing and frequency of the two conditions vary with respect to the bullishness and bearishness of the Nasdaq composite. BMP>.95 is frequent during the big bull run of the Nasdaq in late '99 and beginning of 2000, while BMP<-.95 is less frequent during the big bear run during the last four months of 2000. What does this tell us? BMP is not necessarily going to work well as a trend device for the Nasdaq composite. In Part II I will look closer at the behavior BMP versus the McCellan like oscillator of new highs minus new lows. Other parts to this series: Part II Part III |
Market index trading on a daily basis.
| Title: | Staff Writer |
| Company: | Technical Analysis, Inc. |
| Address: | 4757 California Ave SW |
| Seattle, WA 98116-4499 | |
| Phone # for sales: | 206 938 0570 |
| Fax: | 206 938 1307 |
| Website: | www.traders.com |
| E-mail address: | dpeterson@traders.com |
Traders' Resource Links | |
| Charting the Stock Market: The Wyckoff Method -- Books | |
| Working-Money.com -- Online Trading Services | |
| Traders.com Advantage -- Online Trading Services | |
| Technical Analysis of Stocks & Commodities -- Publications and Newsletters | |
| Working Money, at Working-Money.com -- Publications and Newsletters | |
| Traders.com Advantage -- Publications and Newsletters | |
| Professional Traders Starter Kit -- Software | |
Click here for more information about our publications!
Comments

Request Information From Our Sponsors
- StockCharts.com, Inc.
- Candle Patterns
- Candlestick Charting Explained
- Intermarket Technical Analysis
- John Murphy on Chart Analysis
- John Murphy's Chart Pattern Recognition
- John Murphy's Market Message
- MurphyExplainsMarketAnalysis-Intermarket Analysis
- MurphyExplainsMarketAnalysis-Visual Analysis
- StockCharts.com
- Technical Analysis of the Financial Markets
- The Visual Investor
- VectorVest, Inc.
- Executive Premier Workshop
- One-Day Options Course
- OptionsPro
- Retirement Income Workshop
- Sure-Fire Trading Systems (VectorVest, Inc.)
- Trading as a Business Workshop
- VectorVest 7 EOD
- VectorVest 7 RealTime/IntraDay
- VectorVest AutoTester
- VectorVest Educational Services
- VectorVest OnLine
- VectorVest Options Analyzer
- VectorVest ProGraphics v6.0
- VectorVest ProTrader 7
- VectorVest RealTime Derby Tool
- VectorVest Simulator
- VectorVest Variator
- VectorVest Watchdog
