HOT TOPICS LIST
- MACD
- Fibonacci
- RSI
- Gann
- ADXR
- Stochastics
- Volume
- Triangles
- Futures
- Cycles
- Volatility
- ZIGZAG
- MESA
- Retracement
- Aroon
INDICATORS LIST
LIST OF TOPICS
PRINT THIS ARTICLE
by Dennis D. Peterson
What is this indicator? Does it work? Something new or just a different look at what you might have already observed?
Position: N/A
Dennis D. Peterson
Market index trading on a daily basis.
PRINT THIS ARTICLE
BULL/BEAR MARKET
Balance of Market Power (Part II of III)
08/22/01 03:52:23 PMby Dennis D. Peterson
What is this indicator? Does it work? Something new or just a different look at what you might have already observed?
Position: N/A
| What you have seen thus far is that BMP has a logical foundation and when compared to intraday behavior has a basis in trading behavior. Livshin has given us a way to understand what a very straightforward equation, namely (close-open)/(high-low) is telling us. The equation surprisingly contains a wealth of information when it comes to understanding bull versus bear. And, it has the virtue of not requiring choosing the number of periods. It is up to you and I to see if there is something to capitalize on in terms of an indicator, oscillator or event trigger. |
| Looking at the behavior of BMP from Part I suggests that maybe the best use of BMP lies in using it as an event trigger. The trigger nominally being when BMP>.95 or BMP<-.95 as opposed to some other thresholds. In Part I, I concluded that there are issues in using BMP as a trend indicator. |

|
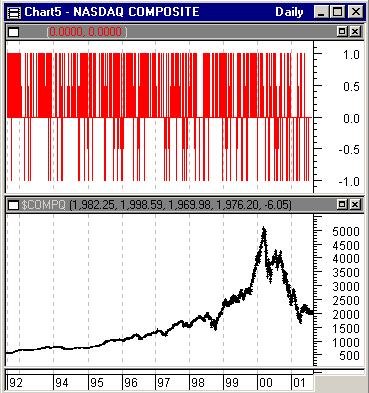
| Figure 1: Nasdaq daily price history (bottom chart) and BMP>.95 true is +1 and BMP <-.95 is –1 (top chart). |
| Graphic provided by: MetaStock. |
| Graphic provided by: Data vendor: eSignal<. |
| |
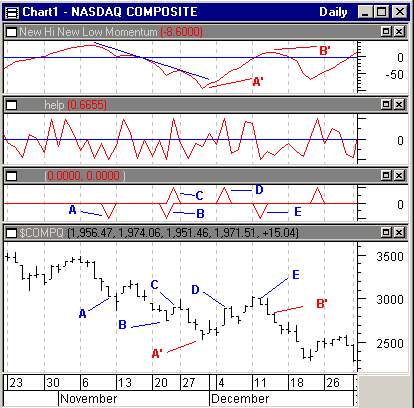
| If I look at the overall picture of the Nasdaq what I see (Figure 1) is that the frequency of occurrence of BMP>.95 and BMP<-.95 can follow price trend when there is a gradual increase in price. When prices trend down with volatility there is some vulnerability to using BMP because BMP<-.95 is not predominant. This suggests that BMP may be better suited to commodities, which can have prolonged price increases or decreases. I need to take a closer look at the behavior of BMP and compare it another technique for establishing bullishness and bearishness to see how well BMP can be used.  Figure 2: McClellan like oscillator of new highs minus lows (top chart), BMP (second chart from top), BMP>.95 true is +1 and BMP <-.95 is -1 (third chart from top), Nasdaq composite (bottom chart). |
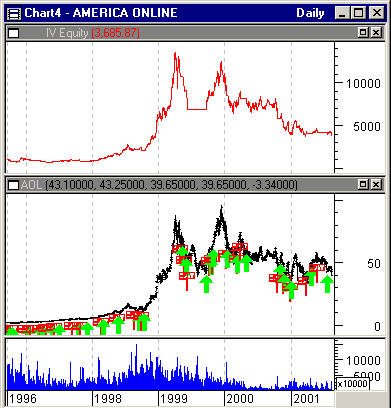
| I have identified a peak and valley of the McClellan like oscillator with the notation of A' and B' and shown where the peak and valley occur with respect to the Nasdaq composite Figure 2: top and bottom charts). If you were trading QQQ looking at a long position with valley A', with a price confirmation of today's open being greater than yesterday's close, you are long on Dec 5 with an open of QQQ=66 (QQQ close of 63 on Dec 4). Since you can see that Dec 14 is not shaping up to be a third day reversal and continue the upswing started on Dec 5, you are out early (QQQ=67), i.e. don't wait until market close, on Dec 14 with condition B', or better yet use trailing stops and capture QQQ=71. Not terrific, but not bad either. Since I have chosen BMP as an event trigger I have to ask myself does BMP>.95 mean I am at the end of downswing and therefore use it as a reversal or does BMP>.95 mean a continuation of an upswing, or maybe a pivot peak? And the same questions for BMP<-.95. The raw values of BMP (Figure 2; second chart from top) still show little sign of a trend even at this level of detail. I now look at where BMP events A through E correspond to the daily price movements of the Nasdaq composite (Figure 2; bottom and second chart from bottom). Looking at event A, you see that A is bearish, but within two days of event A price starts to swing up, but it is only the start of a third day reversal sequence that maintains the downtrend. So what did A tell you? At best it was a continuation. Not much of an event. B and C potentially are even more devastating. If you take B as a potential swing valley, and you condition your trade that the next day is bullish, i.e. BMP>.95 =event C, you are in long, only to take a loss two days later on November 28, which can be minimized by a stop loss. Not much fun. And as you can see trading the McClellan like oscillator from November 8 through November28 as a short you did better. But event D does look hopeful to signal a small upswing. Better yet is November 8, which looks like it must be very close to being a BMP event, and it signals a downswing. If I create a simple trading system by long entry: if yesterday's BMP > opt1, letting opt1 take the range from .6 to .95 in .02 increments, AND today's open is greater than yesterday's close and long exit: if BMP < -opt2, letting opt2 range through the same values as opt1, AND today's open be less than yesterday's close, the system finds that opt1=.7 and opt2=.78 for the maximum profit shown in Figure 4 using a $1,000 initial investment. The conditions for yesterday are the setup, entry is keyed on how today's open compares with yesterday's close.  Figure 3: AOL daily price and volume history (bottom two charts) and $1,000 equity performance (top chart). |
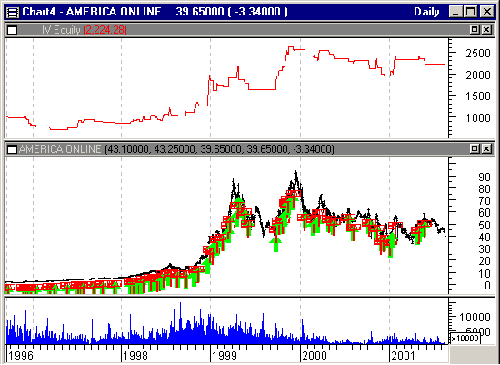
The equity performance (Figure 3:top chart) shows some serious drawdowns. The exit condition is a bit strong, but was designed to stop from exiting too soon because the behavior of BMP on the downside is to have fewer events than on the upside. Changing the exit condition so that either BMP<-opt2 OR today's open less than yesterday's close should improve the drawndown performance considerably. The result, again starting with $1,000, is shown in Figure 4. Figure4: AOL daily price and volume history (bottom two charts) and $1,000 equity performance. This (Figure 4) is what you would expect from Part I. With BMP>.95 being a prevalent event on the upside it is no surprise that you can require that BMP>opt1, AND today's open > yesterday's close and catch the upside. But on the downside the chances of getting BMP And as far as shorts go, you can't even consider them if you see a peak that is not covered by your longs, because you are very likely to be short while prices are rising. A good way to make your broker richer with more trades, but not promising as a way to make a living. What I want to do is go back to event D (Figure 2) and the near event on March 8, which I will in Part III. Other parts to this series: Part I Part III |
Market index trading on a daily basis.
| Title: | Staff Writer |
| Company: | Technical Analysis, Inc. |
| Address: | 4757 California Ave SW |
| Seattle, WA 98116-4499 | |
| Phone # for sales: | 206 938 0570 |
| Fax: | 206 938 1307 |
| Website: | www.traders.com |
| E-mail address: | dpeterson@traders.com |
Traders' Resource Links | |
| Charting the Stock Market: The Wyckoff Method -- Books | |
| Working-Money.com -- Online Trading Services | |
| Traders.com Advantage -- Online Trading Services | |
| Technical Analysis of Stocks & Commodities -- Publications and Newsletters | |
| Working Money, at Working-Money.com -- Publications and Newsletters | |
| Traders.com Advantage -- Publications and Newsletters | |
| Professional Traders Starter Kit -- Software | |
Click here for more information about our publications!
Comments

Request Information From Our Sponsors
- VectorVest, Inc.
- Executive Premier Workshop
- One-Day Options Course
- OptionsPro
- Retirement Income Workshop
- Sure-Fire Trading Systems (VectorVest, Inc.)
- Trading as a Business Workshop
- VectorVest 7 EOD
- VectorVest 7 RealTime/IntraDay
- VectorVest AutoTester
- VectorVest Educational Services
- VectorVest OnLine
- VectorVest Options Analyzer
- VectorVest ProGraphics v6.0
- VectorVest ProTrader 7
- VectorVest RealTime Derby Tool
- VectorVest Simulator
- VectorVest Variator
- VectorVest Watchdog
- StockCharts.com, Inc.
- Candle Patterns
- Candlestick Charting Explained
- Intermarket Technical Analysis
- John Murphy on Chart Analysis
- John Murphy's Chart Pattern Recognition
- John Murphy's Market Message
- MurphyExplainsMarketAnalysis-Intermarket Analysis
- MurphyExplainsMarketAnalysis-Visual Analysis
- StockCharts.com
- Technical Analysis of the Financial Markets
- The Visual Investor
