HOT TOPICS LIST
- MACD
- Fibonacci
- RSI
- Gann
- ADXR
- Stochastics
- Volume
- Triangles
- Futures
- Cycles
- Volatility
- ZIGZAG
- MESA
- Retracement
- Aroon
INDICATORS LIST
LIST OF TOPICS
PRINT THIS ARTICLE
by Matt Blackman
The SPY has produced at least five bearish rising wedges since the meltdown began in late 2000. I hate to be the bearer of bad news but it looks like number six may be nearing completion.
Position: N/A
Matt Blackman
Matt Blackman is a full-time technical and financial writer and trader. He produces corporate and financial newsletters, and assists clients in getting published in the mainstream media. He is the host of TradeSystemGuru.com. Matt has earned the Chartered Market Technician (CMT) designation. Find out what stocks and futures Matt is watching on Twitter at www.twitter.com/RatioTrade
PRINT THIS ARTICLE
WEDGE FORMATIONS
The Continuous Curse of the Rising Wedge
04/24/03 08:36:44 AMby Matt Blackman
The SPY has produced at least five bearish rising wedges since the meltdown began in late 2000. I hate to be the bearer of bad news but it looks like number six may be nearing completion.
Position: N/A
| Rising wedges are the conscience of a bear market it would seem, just to prevent the bulls from forgetting what type of market they are in. The major indexes have produced a fair share of them in the last three years. They are one of the more common types of bear traps, and trap they do with uncanny regularity (see "Bearish Rising Wedges Abound", TA 12/05/02). |
| The good news is that they are quite easy to spot. Simply look for a wedge pattern pointing in the opposite direction of the dominant trend, draw a trendline on one side, a channel line on the other and viola! The other dead giveaway is the declining volume while the wedge builds. When the breakdown finally occurs look for volume to increase: the bigger the increase, the more bearish the breakdown. In "Another Chance for the S&P500" TA, 04/11/03, I discussed a potential bullish head & shoulders bottom (HSB) taking shape in the S&P500 but alas, if the current wedge kicks into gear, the bullish HSB will be rendered void or at least seriously handicapped. |

|
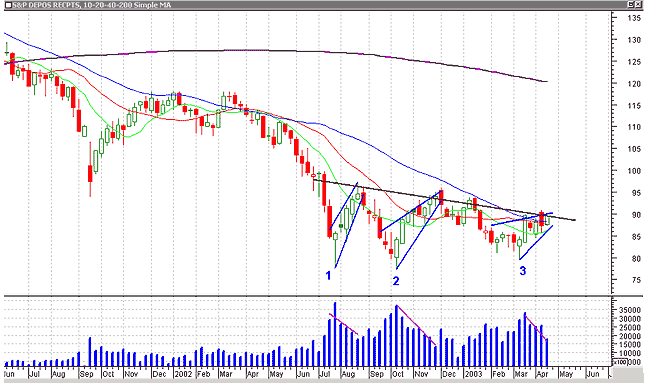
| Figure 1 – Weekly chart of the Standard & Poor’s Deposits/Receipts (SPY). |
| Graphic provided by: MetaStock. |
| |
| While the chart shows three rising wedges from mid-2001 to the present, there have been a total of six since 2000. Notice the declining volume as each forms followed by a spike when it breaks down. Note the conflict between the last rising wedge and the potential HSB pattern with left shoulder at 1, potential right shoulder at 3 and head at 2 with the dark red neckline. Some of you may also notice the symmetrical triangle formation starting from July 2002 to present. The only problem is that such continuation patterns should only last three to four months, but this one is nearly 10 months old now. The fundamentals are at odds as well. Last week, John Bollinger pointed out that earnings news, at least in the early going, was positive with approximately two-thirds of the companies reporting positive earnings to one-third negative. This is the reverse of the bear ratio until recently and a bullish omen if it persists through the current earnings season. It also harks back to the "norm" during the bull run prior to the meltdown in 2000. |
| On the flipside, there are still a number of negative fundamentals currently haunting markets, not the least of which being the stubbornly generous valuations evidenced by high price/earnings, price/sales and free cash flow ratios for this time in the economic cycle (see "10 Fundamental Challenges Facing a Market Rebound", WM 12/17/02.). |
| The conclusion? That is the million-dollar question but it certainly looks like at least a short-term correction over the next hill to me. Where it goes from there is anyone's guess, but be careful. It's a jungle out there! I am watching intermarket relationships, the ARMS (TRIN) and McClelland indicators for divergence clues. |
Matt Blackman is a full-time technical and financial writer and trader. He produces corporate and financial newsletters, and assists clients in getting published in the mainstream media. He is the host of TradeSystemGuru.com. Matt has earned the Chartered Market Technician (CMT) designation. Find out what stocks and futures Matt is watching on Twitter at www.twitter.com/RatioTrade
| Company: | TradeSystemGuru.com |
| Address: | Box 2589 |
| Garibaldi Highlands, BC Canada | |
| Phone # for sales: | 604-898-9069 |
| Fax: | 604-898-9069 |
| Website: | www.tradesystemguru.com |
| E-mail address: | indextradermb@gmail.com |
Traders' Resource Links | |
| TradeSystemGuru.com has not added any product or service information to TRADERS' RESOURCE. | |
Click here for more information about our publications!
Comments
Date: 04/30/03Rank: 5Comment:
Date: 05/15/03Rank: 3Comment:

Request Information From Our Sponsors
- VectorVest, Inc.
- Executive Premier Workshop
- One-Day Options Course
- OptionsPro
- Retirement Income Workshop
- Sure-Fire Trading Systems (VectorVest, Inc.)
- Trading as a Business Workshop
- VectorVest 7 EOD
- VectorVest 7 RealTime/IntraDay
- VectorVest AutoTester
- VectorVest Educational Services
- VectorVest OnLine
- VectorVest Options Analyzer
- VectorVest ProGraphics v6.0
- VectorVest ProTrader 7
- VectorVest RealTime Derby Tool
- VectorVest Simulator
- VectorVest Variator
- VectorVest Watchdog
- StockCharts.com, Inc.
- Candle Patterns
- Candlestick Charting Explained
- Intermarket Technical Analysis
- John Murphy on Chart Analysis
- John Murphy's Chart Pattern Recognition
- John Murphy's Market Message
- MurphyExplainsMarketAnalysis-Intermarket Analysis
- MurphyExplainsMarketAnalysis-Visual Analysis
- StockCharts.com
- Technical Analysis of the Financial Markets
- The Visual Investor
