HOT TOPICS LIST
- MACD
- Fibonacci
- RSI
- Gann
- ADXR
- Stochastics
- Volume
- Triangles
- Futures
- Cycles
- Volatility
- ZIGZAG
- MESA
- Retracement
- Aroon
INDICATORS LIST
LIST OF TOPICS
PRINT THIS ARTICLE
by Matt Blackman
A major bearish head & shoulders top pattern that began forming in 1998 is still alive and well, but a smaller version of its bullish twin is taking shape. Could it be sign that this bear market is about to turn or just another false alarm?
Position: N/A
Matt Blackman
Matt Blackman is a full-time technical and financial writer and trader. He produces corporate and financial newsletters, and assists clients in getting published in the mainstream media. He is the host of TradeSystemGuru.com. Matt has earned the Chartered Market Technician (CMT) designation. Find out what stocks and futures Matt is watching on Twitter at www.twitter.com/RatioTrade
PRINT THIS ARTICLE
HEAD & SHOULDERS
Another Chance for the S&P 500?
04/11/03 08:58:00 AMby Matt Blackman
A major bearish head & shoulders top pattern that began forming in 1998 is still alive and well, but a smaller version of its bullish twin is taking shape. Could it be sign that this bear market is about to turn or just another false alarm?
Position: N/A
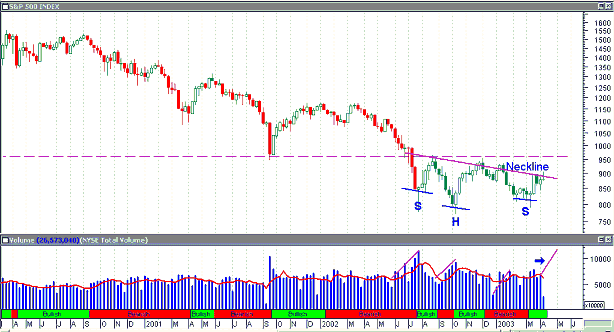
| The bearish head & shoulders top (HST) pattern that began forming more than four years ago on the S&P 500 Index ($SPX) with a neckline at 965 does not bode well for the market's longer-term growth if it holds (see The Critical Head & Shoulders Test - Working Money, 11/12/02). But a much smaller head & shoulders bottom (HSB) pattern that began in June 2002 is showing that the index is at least trying to rally. |
| As one of the most reliable reversal patterns, a head & shoulders signals a potential turn in the markets. The longer it takes to form, the more reliable it is. For this HSB to be confirmed, volume will have to show more support of upside price moves. What the index will also need to kill the bear is a spike in volume on upward price movement (see blue arrow) and a decisive and sustained break of the 965 neckline (see dashed line). |

|
| Figure 1: Weekly S&P 500 index ($SPX) showing the most recent head & shoulders pattern, but this time it's a bullish bottom. The dashed line shows the neckline of its much larger evil cousin at 965. Note the volume spikes on falling price, which is bearish (first three magenta lines in the volume window). |
| Graphic provided by: MetaStock. |
| |
| Many fundamental analysts have been espousing the fact that once the war in Iraq was over markets should rally. Well, the war is pretty much over but the market dropped following television images of Iraqi citizens exercising their newfound freedom in tearing down the last vestiges of Saddams' tyranny in Baghdad. Now traders and investors realize that the war can no longer be used as an excuse for insipid stock price movement. |
| In the coming days, the focus will shift to corporate and economic fundamentals. If both fail to deliver, this bear will continue to rule the landscape. |
Matt Blackman is a full-time technical and financial writer and trader. He produces corporate and financial newsletters, and assists clients in getting published in the mainstream media. He is the host of TradeSystemGuru.com. Matt has earned the Chartered Market Technician (CMT) designation. Find out what stocks and futures Matt is watching on Twitter at www.twitter.com/RatioTrade
| Company: | TradeSystemGuru.com |
| Address: | Box 2589 |
| Garibaldi Highlands, BC Canada | |
| Phone # for sales: | 604-898-9069 |
| Fax: | 604-898-9069 |
| Website: | www.tradesystemguru.com |
| E-mail address: | indextradermb@gmail.com |
Traders' Resource Links | |
| TradeSystemGuru.com has not added any product or service information to TRADERS' RESOURCE. | |
Click here for more information about our publications!
PRINT THIS ARTICLE

Request Information From Our Sponsors
- VectorVest, Inc.
- Executive Premier Workshop
- One-Day Options Course
- OptionsPro
- Retirement Income Workshop
- Sure-Fire Trading Systems (VectorVest, Inc.)
- Trading as a Business Workshop
- VectorVest 7 EOD
- VectorVest 7 RealTime/IntraDay
- VectorVest AutoTester
- VectorVest Educational Services
- VectorVest OnLine
- VectorVest Options Analyzer
- VectorVest ProGraphics v6.0
- VectorVest ProTrader 7
- VectorVest RealTime Derby Tool
- VectorVest Simulator
- VectorVest Variator
- VectorVest Watchdog
- StockCharts.com, Inc.
- Candle Patterns
- Candlestick Charting Explained
- Intermarket Technical Analysis
- John Murphy on Chart Analysis
- John Murphy's Chart Pattern Recognition
- John Murphy's Market Message
- MurphyExplainsMarketAnalysis-Intermarket Analysis
- MurphyExplainsMarketAnalysis-Visual Analysis
- StockCharts.com
- Technical Analysis of the Financial Markets
- The Visual Investor
