HOT TOPICS LIST
- MACD
- Fibonacci
- RSI
- Gann
- ADXR
- Stochastics
- Volume
- Triangles
- Futures
- Cycles
- Volatility
- ZIGZAG
- MESA
- Retracement
- Aroon
INDICATORS LIST
LIST OF TOPICS
PRINT THIS ARTICLE
by Andrew Hetherington
A flag formation inside of a larger triangle anticipates a breakout for F5 Networks.
Position: N/A
Andrew Hetherington
Classic Dow Theorist who trades as a pure technician, using pattern recognition.
PRINT THIS ARTICLE
CHART ANALYSIS
Smooth Surfing for F5 Networks Inc.
03/24/03 01:52:38 PMby Andrew Hetherington
A flag formation inside of a larger triangle anticipates a breakout for F5 Networks.
Position: N/A
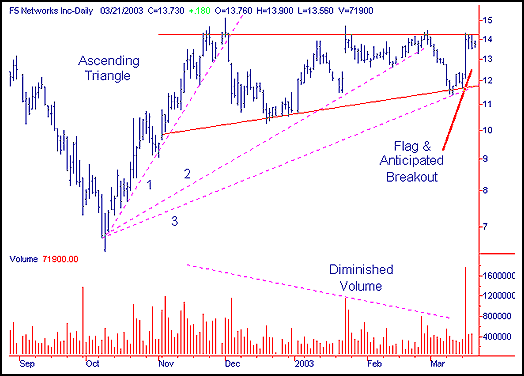
 Figure 1: Daily chart of FFIV. |
| The daily chart for F5 Networks (FFIV) shows a 5-month ascending triangle with diminished volume on the creation of the pattern. Although this volume is less than perfect, it is still diminished from left to right. The tops and bottoms are clearly defined and now a flag pattern has developed prior to the anticipated breakout topside. The anticipated breakout is in the $14.60 area. As the pattern develops, volume needs to continue picking up to overcome the resistance at $14.60. The third fan line has been created, similar to many other equities, and can be use as a guide to protect against downside risk. If this line is broken, currently in the $12.00 area, then sell out long positions for a small loss. |

|
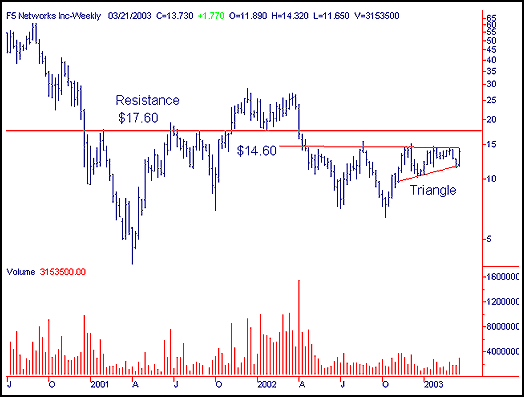
| Figure 2: Weekly chart of FFIV. |
| Graphic provided by: SuperCharts. |
| |
| On the weekly chart, note the strong the resistance in the $14.60 area. In addition, selling can be anticipated after the breakout and the expected advance towards the next resistance area in the $17.60 area. This is the likely point where it will run out of steam and take a breather. |
Classic Dow Theorist who trades as a pure technician, using pattern recognition.
| Toronto, Canada |
Click here for more information about our publications!
Comments
Date: 03/25/03Rank: 4Comment:

Request Information From Our Sponsors
- StockCharts.com, Inc.
- Candle Patterns
- Candlestick Charting Explained
- Intermarket Technical Analysis
- John Murphy on Chart Analysis
- John Murphy's Chart Pattern Recognition
- John Murphy's Market Message
- MurphyExplainsMarketAnalysis-Intermarket Analysis
- MurphyExplainsMarketAnalysis-Visual Analysis
- StockCharts.com
- Technical Analysis of the Financial Markets
- The Visual Investor
- VectorVest, Inc.
- Executive Premier Workshop
- One-Day Options Course
- OptionsPro
- Retirement Income Workshop
- Sure-Fire Trading Systems (VectorVest, Inc.)
- Trading as a Business Workshop
- VectorVest 7 EOD
- VectorVest 7 RealTime/IntraDay
- VectorVest AutoTester
- VectorVest Educational Services
- VectorVest OnLine
- VectorVest Options Analyzer
- VectorVest ProGraphics v6.0
- VectorVest ProTrader 7
- VectorVest RealTime Derby Tool
- VectorVest Simulator
- VectorVest Variator
- VectorVest Watchdog
