HOT TOPICS LIST
- MACD
- Fibonacci
- RSI
- Gann
- ADXR
- Stochastics
- Volume
- Triangles
- Futures
- Cycles
- Volatility
- ZIGZAG
- MESA
- Retracement
- Aroon
INDICATORS LIST
LIST OF TOPICS
PRINT THIS ARTICLE
by Andrew Hetherington
A triangle formation on Juniper Nerworks (JNPR) chart has a bullish tendency but it will not break out unless the volume continues to increase.
Position: N/A
Andrew Hetherington
Classic Dow Theorist who trades as a pure technician, using pattern recognition.
PRINT THIS ARTICLE
CHART ANALYSIS
Is Juniper Networks on the Brink of Breaking Out?
03/21/03 12:09:49 PMby Andrew Hetherington
A triangle formation on Juniper Nerworks (JNPR) chart has a bullish tendency but it will not break out unless the volume continues to increase.
Position: N/A
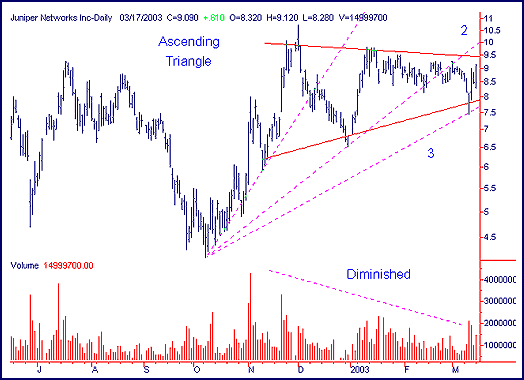
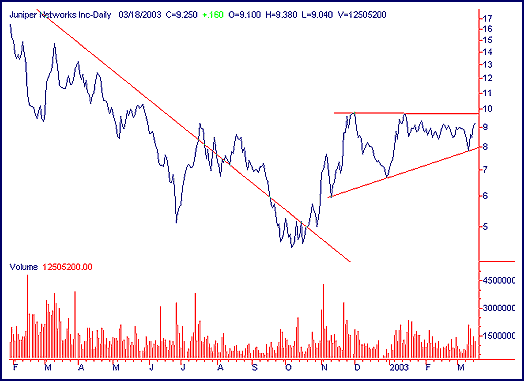
 Figure 1: Daily chart of Juniper Networks showing an ascending/symmetrical triangle using the tip of the tops and bottoms.  Figure 2: Daily chart of Juniper Networks showing an ascending triangle formation using line on close style of charting. On the above daily charts, Juniper Networks is forming a 5-month symmetrical/ascending triangle. It is a symmetrical triangle (Figure 1) if you draw your lines from the tip of the tops and bottoms, and it is an ascending (Figure 2) if you use the line on close style of chart. I say it is an ascending triangle. |
| The volume on the pattern is clearly diminished and it has just bounced off of the bottom line of the triangle. These triangles have a bullish tendency but it will not break out unless the volume continues to increase. My belief is that JNPR will break out in the $9.75 area and move to the higher resistance at or near $13.00. A word of caution is needed : A stop-loss is necessary to protect your downside risk in the $8.00 area along the bottom triangle line. If by chance you prefer my performance line (third fan line) as your stop-loss, be aware that it slopes upwards and adjust your stop-loss as time goes on. When it breaks topside as I anticipate, I would use the third fan line as my guide until it is broken. This may take from days to weeks but it generally helps you maintain your long position until the end of the ride, whenever that is. |

|
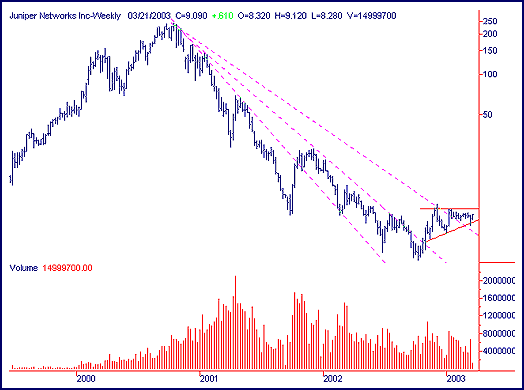
| Figure 3: Weekly chart of Juniper Networks. |
| Graphic provided by: SuperCharts. |
| |
| The long-term downtrend was broken in November on high volume. It consolidated over the next several months creating this triangle and is now ready for this bottom reversal pattern to spring higher. |
Classic Dow Theorist who trades as a pure technician, using pattern recognition.
| Toronto, Canada |
Click here for more information about our publications!
Comments
Date: 03/21/03Rank: 4Comment:
Date: 03/23/03Rank: 5Comment:
Date: 03/27/03Rank: 5Comment:

|

Request Information From Our Sponsors
- StockCharts.com, Inc.
- Candle Patterns
- Candlestick Charting Explained
- Intermarket Technical Analysis
- John Murphy on Chart Analysis
- John Murphy's Chart Pattern Recognition
- John Murphy's Market Message
- MurphyExplainsMarketAnalysis-Intermarket Analysis
- MurphyExplainsMarketAnalysis-Visual Analysis
- StockCharts.com
- Technical Analysis of the Financial Markets
- The Visual Investor
- VectorVest, Inc.
- Executive Premier Workshop
- One-Day Options Course
- OptionsPro
- Retirement Income Workshop
- Sure-Fire Trading Systems (VectorVest, Inc.)
- Trading as a Business Workshop
- VectorVest 7 EOD
- VectorVest 7 RealTime/IntraDay
- VectorVest AutoTester
- VectorVest Educational Services
- VectorVest OnLine
- VectorVest Options Analyzer
- VectorVest ProGraphics v6.0
- VectorVest ProTrader 7
- VectorVest RealTime Derby Tool
- VectorVest Simulator
- VectorVest Variator
- VectorVest Watchdog
