HOT TOPICS LIST
- MACD
- Fibonacci
- RSI
- Gann
- ADXR
- Stochastics
- Volume
- Triangles
- Futures
- Cycles
- Volatility
- ZIGZAG
- MESA
- Retracement
- Aroon
INDICATORS LIST
LIST OF TOPICS
PRINT THIS ARTICLE
by Andrew Hetherington
Playing a scallop formation is easier than identifying one.
Position: N/A
Andrew Hetherington
Classic Dow Theorist who trades as a pure technician, using pattern recognition.
PRINT THIS ARTICLE
SCALLOPS
Sanmina Corporation is Rounding Higher
03/20/03 08:42:45 AMby Andrew Hetherington
Playing a scallop formation is easier than identifying one.
Position: N/A
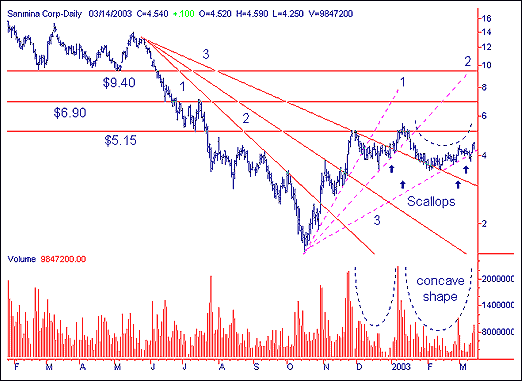
 Figure 1: Daily chart of Sanmina Corporation. Sanmina Corporation (SANM) is poised to move higher in the near term. The daily chart is showing a series of beginning scallops or rounding bottom patterns. In this pattern each successive scallop moves higher in an approximate measurement from the base to the top of the left side of the saucer. There are several names for this pattern including, saucer, bowl, scallop or rounding bottom. All are correct and all have the same look, except the scallop repeats the formation. |
| This often-misdiagnosed pattern is one of the more difficult to identify. Naturally, you must consider the current market direction for support. Always play with the current trend to stay out of trouble, and when in doubt stay out. This pattern has a concave shape in price movement as well as volume. The picture must be near perfect or you take the risk of making an error. I recommend using a stop-loss for protection. In this scenario I suggest my third fan line or my performance line as your exit signal. If this third fan line is broken, protect your capital and sell out your long position immediately. These scallops have a repetitive nature and once the cycle is broken, the volume should change as well. The volume will appear more erratic and less distinct to the concave shape. Watch the volume closely. The appropriate time to buy a long position is on the dormant bottom with light volume and not on the high volume spikes. These spikes indicate the end is near and the topping out process is upon us. These patterns take anywhere from three to seven weeks to create and can be profitable if played correctly. |

|
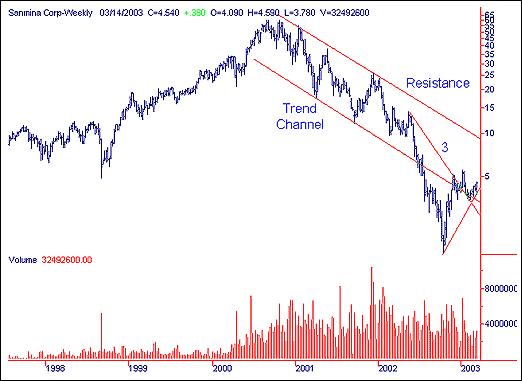
| Figure 2: Weekly chart of Sanmina Corporation. |
| Graphic provided by: SuperCharts. |
| |
| In Sanmina's case I expect a rise up towards the resistance area of $6.90. After topping out in this area or slightly lower there should be another buying opportunity on the next scallop. This should be followed by a descent in price and a diminished looking volume picture. At this point I would take my position as close to the third fan line of buying demand as possible. This fan line is my demand line. If it is broken take a small-calculated loss. |
Classic Dow Theorist who trades as a pure technician, using pattern recognition.
| Toronto, Canada |
Click here for more information about our publications!
Comments
Date: 03/20/03Rank: 3Comment:

Request Information From Our Sponsors
- StockCharts.com, Inc.
- Candle Patterns
- Candlestick Charting Explained
- Intermarket Technical Analysis
- John Murphy on Chart Analysis
- John Murphy's Chart Pattern Recognition
- John Murphy's Market Message
- MurphyExplainsMarketAnalysis-Intermarket Analysis
- MurphyExplainsMarketAnalysis-Visual Analysis
- StockCharts.com
- Technical Analysis of the Financial Markets
- The Visual Investor
- VectorVest, Inc.
- Executive Premier Workshop
- One-Day Options Course
- OptionsPro
- Retirement Income Workshop
- Sure-Fire Trading Systems (VectorVest, Inc.)
- Trading as a Business Workshop
- VectorVest 7 EOD
- VectorVest 7 RealTime/IntraDay
- VectorVest AutoTester
- VectorVest Educational Services
- VectorVest OnLine
- VectorVest Options Analyzer
- VectorVest ProGraphics v6.0
- VectorVest ProTrader 7
- VectorVest RealTime Derby Tool
- VectorVest Simulator
- VectorVest Variator
- VectorVest Watchdog
