HOT TOPICS LIST
- MACD
- Fibonacci
- RSI
- Gann
- ADXR
- Stochastics
- Volume
- Triangles
- Futures
- Cycles
- Volatility
- ZIGZAG
- MESA
- Retracement
- Aroon
INDICATORS LIST
LIST OF TOPICS
PRINT THIS ARTICLE
by Andrew Hetherington
As safe an investment as there is in the current market? The charts show why.
Position: N/A
Andrew Hetherington
Classic Dow Theorist who trades as a pure technician, using pattern recognition.
PRINT THIS ARTICLE
CHART ANALYSIS
Bema Gold is Poised to Run Higher
03/14/03 10:39:52 AMby Andrew Hetherington
As safe an investment as there is in the current market? The charts show why.
Position: N/A
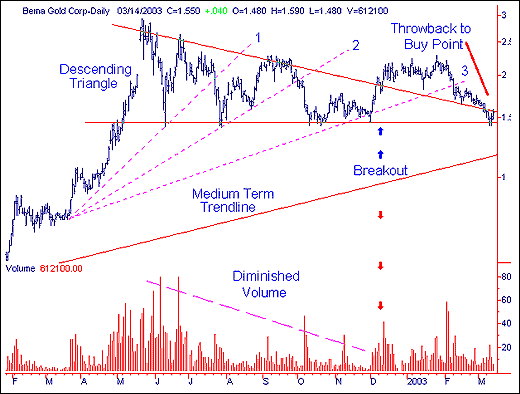
 Figure 1: Daily chart of Bema Gold. The daily chart of Bema Gold shows an 8-month descending triangle with diminished volume on the creation of the pattern. Although these patterns have a bearish tendency, I cannot ignore the large volume breakout and the distinctness of the tops and bottoms. There has been a temporary change in direction from up to down with the breaking of the third fan line. This temporary situation presents the opportunity to buy a long position on the throwback. A strong breakout on higher volume confirmed the pattern. |

|
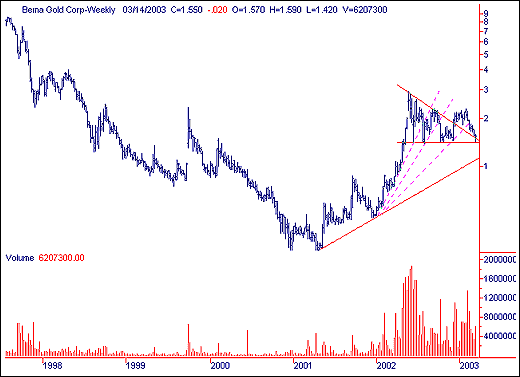
| Figure 2: Weekly chart of Bema Gold. |
| Graphic provided by: SuperCharts. |
| |
| On the weekly chart the medium-term trendline support is in the $1.15 CDN area. Keep in mind I've illustrated the Canadian chart. This is a duo-listed equity in New York and Toronto. The US chart looks identical to the Canadian chart. They trade under the BGO symbol on both exchanges. The current US price is $1.04. |
| Buying a long position in the cradle in the $1.04 US or $1.55 CDN. is as safe an investment as there is in the market place currently. Anticipating gold prices to move higher towards the $400.00 area after the current throwback to the $330.00 US will make this happen. |
Classic Dow Theorist who trades as a pure technician, using pattern recognition.
| Toronto, Canada |
Click here for more information about our publications!
Comments
Date: 08/19/03Rank: 5Comment: I bought this stock at $1.54 Can and have watched it double.
Thanks, Andrew.
Bob

Request Information From Our Sponsors
- StockCharts.com, Inc.
- Candle Patterns
- Candlestick Charting Explained
- Intermarket Technical Analysis
- John Murphy on Chart Analysis
- John Murphy's Chart Pattern Recognition
- John Murphy's Market Message
- MurphyExplainsMarketAnalysis-Intermarket Analysis
- MurphyExplainsMarketAnalysis-Visual Analysis
- StockCharts.com
- Technical Analysis of the Financial Markets
- The Visual Investor
- VectorVest, Inc.
- Executive Premier Workshop
- One-Day Options Course
- OptionsPro
- Retirement Income Workshop
- Sure-Fire Trading Systems (VectorVest, Inc.)
- Trading as a Business Workshop
- VectorVest 7 EOD
- VectorVest 7 RealTime/IntraDay
- VectorVest AutoTester
- VectorVest Educational Services
- VectorVest OnLine
- VectorVest Options Analyzer
- VectorVest ProGraphics v6.0
- VectorVest ProTrader 7
- VectorVest RealTime Derby Tool
- VectorVest Simulator
- VectorVest Variator
- VectorVest Watchdog
