HOT TOPICS LIST
- MACD
- Fibonacci
- RSI
- Gann
- ADXR
- Stochastics
- Volume
- Triangles
- Futures
- Cycles
- Volatility
- ZIGZAG
- MESA
- Retracement
- Aroon
INDICATORS LIST
LIST OF TOPICS
PRINT THIS ARTICLE
by David Penn
Housing bubble? Maybe not, but the stocks are in trouble.
Position: N/A
David Penn
Technical Writer for Technical Analysis of STOCKS & COMMODITIES magazine, Working-Money.com, and Traders.com Advantage.
PRINT THIS ARTICLE
REVERSAL
Lennar's Diamond Top
03/04/03 01:52:47 PMby David Penn
Housing bubble? Maybe not, but the stocks are in trouble.
Position: N/A
| If price action in the marketplace precedes "fundamental data," then the recent announcement by Federal Reserve board chairman Alan Greenspan that a cooling off of the housing market may be likely in 2003 only underscores the declines once-popular housing stocks have experienced since peaking out in 2002. Two of the major home-building stocks, Toll Brothers (TOLL) and D.R. Horton (DHI) are both down about 40% from their highs. Other stocks, such as KB Homes (KBH) and Centex (CTX) are down a little less than half as much from their highs reached in 2002. Those who believed that the laws of supply and demand exist as powerfully for homes in 2003 as they did for stocks in 2000 may see confirmation of their opinion in numbers like these. |
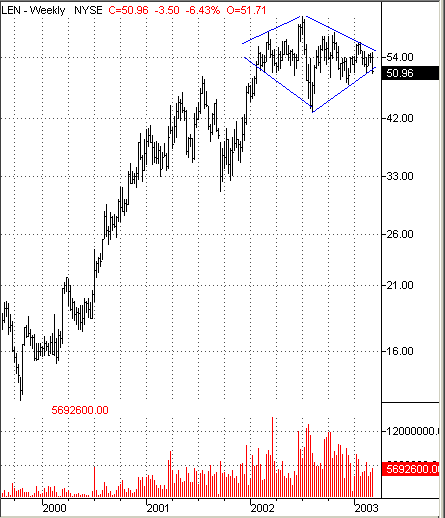
 Figure 1. This weekly chart of Lennar highlights the diamond formation. Note the downtrend in volume. And, perhaps, in charts like the one of homebuilder Lennar, as well. Lennar fits into that latter group of homebuilders, down about 20% from its peak in the summer of 2002. Actually, Lennar has been in a diamond-shaped consolidation range really for all of 2002, a range that includes the peak just shy of 64 in July 2002. While not breaking down in the manner of Toll Brothers or D.R. Horton--both of which are developing bearish descending triangle type formations--Lennar's current diamond top suggests that it too might suffer the same sort of declines others in the homebuilding cohort have experienced. |

|
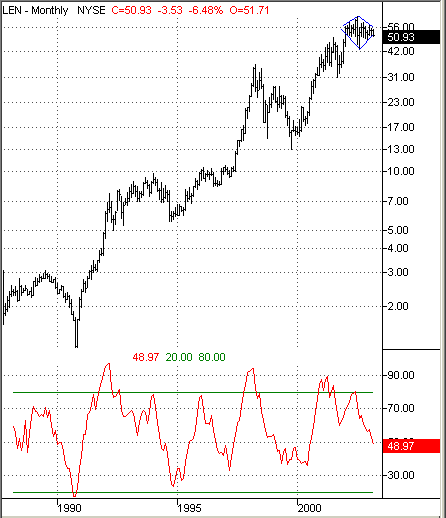
| Figure 2. Dips below 80 in the Money Flow Indicator have historically anticipated declines for Lennar, as this monthly chart shows. |
| Graphic provided by: TradeStation. |
| |
| Diamond formations can serve as continuations--consolidations that lead to a resumption of the trend. However, I think the diamond top is a more compelling possibility here than the diamond continuation for a variety of reasons. For one, shares of Lennar have enjoyed a secular bull market that extends back to the fall of 1990, suffering its only truly sharp declines during the dot.com bubble period from 1998-2000. Second, the fact that a number of like companies are already in clear downtrends--particularly Toll Brothers and D.R. Horton--suggests that Lennar might have a difficult enough time holding its current gains, to say nothing of moving appreciably higher. A third reason is that dips in the money flow indicator have historically anticipated declines in Lennar--and just such a dip in money flow has been in place since Lennar peaked last summer. |
| If the current diamond top is indeed a bearish portent for Lennar, then what sort of downside might be anticipated? The size of the diamond formation--measured by subtracting the value at the lowest point in the formation from the value at the highest point--is about 20 which, from a likely breakout point of 53 (where the two right side converging trendlines would meet), could take Lennar down to 33. As the chart in Figure 1 shows, this is an area of significant support from the lows established in the late summer/early autumn of 2001. |
Technical Writer for Technical Analysis of STOCKS & COMMODITIES magazine, Working-Money.com, and Traders.com Advantage.
| Title: | Technical Writer |
| Company: | Technical Analysis, Inc. |
| Address: | 4757 California Avenue SW |
| Seattle, WA 98116 | |
| Phone # for sales: | 206 938 0570 |
| Fax: | 206 938 1307 |
| Website: | www.Traders.com |
| E-mail address: | DPenn@traders.com |
Traders' Resource Links | |
| Charting the Stock Market: The Wyckoff Method -- Books | |
| Working-Money.com -- Online Trading Services | |
| Traders.com Advantage -- Online Trading Services | |
| Technical Analysis of Stocks & Commodities -- Publications and Newsletters | |
| Working Money, at Working-Money.com -- Publications and Newsletters | |
| Traders.com Advantage -- Publications and Newsletters | |
| Professional Traders Starter Kit -- Software | |
Click here for more information about our publications!
Comments
Date: 03/04/03Rank: 5Comment:

Request Information From Our Sponsors
- StockCharts.com, Inc.
- Candle Patterns
- Candlestick Charting Explained
- Intermarket Technical Analysis
- John Murphy on Chart Analysis
- John Murphy's Chart Pattern Recognition
- John Murphy's Market Message
- MurphyExplainsMarketAnalysis-Intermarket Analysis
- MurphyExplainsMarketAnalysis-Visual Analysis
- StockCharts.com
- Technical Analysis of the Financial Markets
- The Visual Investor
- VectorVest, Inc.
- Executive Premier Workshop
- One-Day Options Course
- OptionsPro
- Retirement Income Workshop
- Sure-Fire Trading Systems (VectorVest, Inc.)
- Trading as a Business Workshop
- VectorVest 7 EOD
- VectorVest 7 RealTime/IntraDay
- VectorVest AutoTester
- VectorVest Educational Services
- VectorVest OnLine
- VectorVest Options Analyzer
- VectorVest ProGraphics v6.0
- VectorVest ProTrader 7
- VectorVest RealTime Derby Tool
- VectorVest Simulator
- VectorVest Variator
- VectorVest Watchdog
