HOT TOPICS LIST
- MACD
- Fibonacci
- RSI
- Gann
- ADXR
- Stochastics
- Volume
- Triangles
- Futures
- Cycles
- Volatility
- ZIGZAG
- MESA
- Retracement
- Aroon
INDICATORS LIST
LIST OF TOPICS
PRINT THIS ARTICLE
by Koos van der Merwe
In my article, "The Nasdaq: Elliott Wave and Kondratieff" (Traders.com Advantage, November 19, 2002), I explained where I believed the Nasdaq was heading, concluding that the Nasdaq was in a B-WAVE up in a long-term bear trend. The following is my interpretation of the Dow using Elliott wave.
Position: Hold
Koos van der Merwe
Has been a technical analyst since 1969, and has worked as a futures and options trader with First Financial Futures in Johannesburg, South Africa.
PRINT THIS ARTICLE
ELLIOTT WAVE
Elliott Wave and the Dow
02/10/03 02:06:26 PMby Koos van der Merwe
In my article, "The Nasdaq: Elliott Wave and Kondratieff" (Traders.com Advantage, November 19, 2002), I explained where I believed the Nasdaq was heading, concluding that the Nasdaq was in a B-WAVE up in a long-term bear trend. The following is my interpretation of the Dow using Elliott wave.
Position: Hold
| Before I start my analysis, I would like to make one assumption: the market collapse of the 1930s that lead to the Great Depression was the end of a major WAVE V. And the bear market that followed was the conclusion of a major Elliott cycle. Having come to this decision, I have started my Elliott count of the Dow from June 1932, when the Dow was at 52. From that date, the Dow moved up to 1001 by February 1966. WAVE I was therefore a move that lasted 34 years, and the Dow rose 949 points. If you remember that this period covered the period of World War II when markets were in flux, and the depths of the Cold War with Russia, you can understand and accept the fall of the Dow to 570 in December 1974. The rise was 949 points (1001 - 52) and the fall was 431 points (1001 - 570). This is a fall of 45%, less than the 70% common for a Wave II, but still a suggestion, promoted by many, that the bear market would continue, and the Dow would fall to below 100 points. Fortunately, this never occurred. The years between February 1966 and December 1974 rid the market of many speculators. Some exchanges, like the Johannesburg Stock exchange, banned short selling (still in force to this day) because of the harm this collapse caused to the stock market. It was a long bear market, almost nine years, that left many investors despondent, something like investors are experiencing now. Remember, it was also the years when the Gold price was taken off the gold standard, and after a year of dallying with a two tiered gold price, one fixed and one paper, gold was allowed to float, and gold soon rose to $800 per oz., following the oil crisis. (Is history repeating itself today?) |
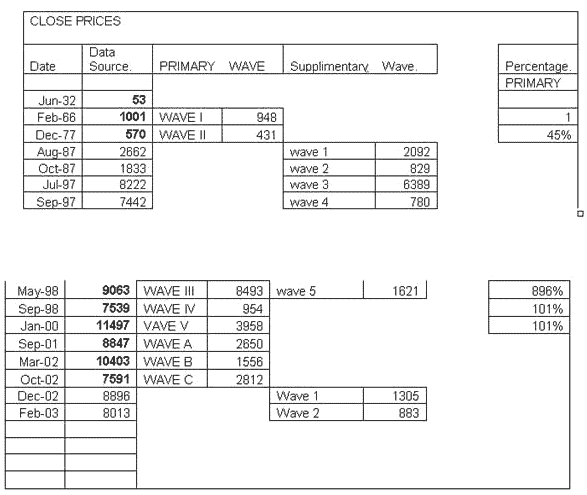
The table below is an Excel spreadsheet of the data with my interpretation of the Elliott wave. Figure 1: Dates and structure of my Elliott wave count. |

|
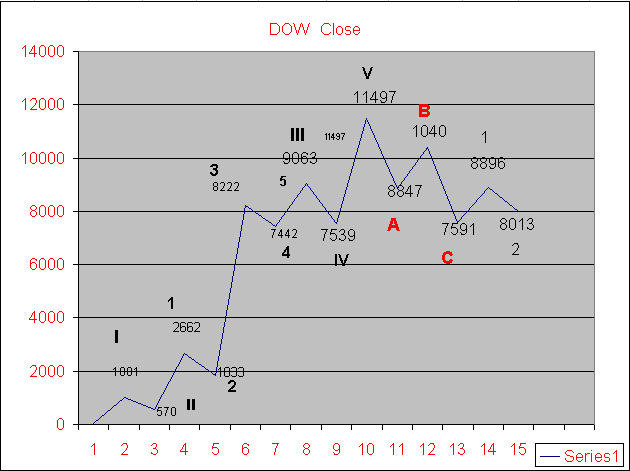
| Figure 2: Excel chart of the Dow. |
| Graphic provided by: Microsoft Excel and Advanced GET. |
| |
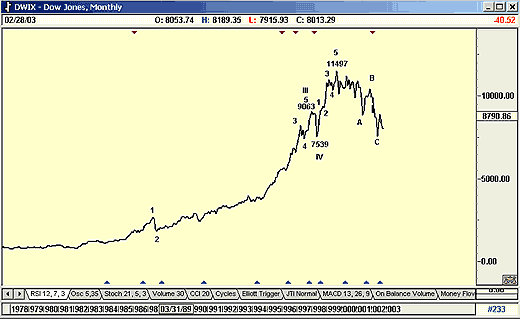
The chart does not include dates, because it is far easier to determine a true Elliott count from a stylized chart than a true chart. I have shown a monthly chart below of the Dow, but only from 1974 onward. The chart is very busy, and a true count can be hidden in the noise. Figure 3: Monthly chart of the Dow from 1974 to the present. Let us analyze the stylized rather than true chart above. Also do refer to the table for dates. |
| WAVE I, completed in February 1966, rose 948 points to top out at 1001. It then retraced in a complicated wave to complete WAVE II in December 1977 at 570, a drop of 431. This fall was 45% of WAVE I's rise. WAVE III rose from 570 to 9063 by May 1998, a rise of 8493 points, or 896% of WAVE I. WAVE IV fell from 9063 to 7539, a fall of 954 points. This is almost equal to twice the value of the fall of WAVE II ( 954/431 = 2.21) Classical Elliott followers like to see Wave IV equal to WAVE II in depth. This did not happen. However classical Elliott also states that when WAVE II is complex, WAVE IV must be simple, and this was the case. WAVE V topped in the bubble of 2002 in January 2002 at 11497. This is normal for WAVE V, which always end in a blowout. The fact that this occurred justifies my decision to start the count from 1932. The market rose from "bubble to bubble," so to speak. The bear market, that is the ABC trend down, must end within the fourth wave of lesser degree. This did happen, with WAVE C falling to 7591. From here, if my wave count is true, the market should start rising in a new bull trend, and indeed it did so, with Wave 1 rising from 7591 to 8896 in December 2002. The market then fell back in Wave 2 to 8013 where it appears to be forming a base. Now, remember, Wave II can be a 100% of Wave I, and is usually a position where many analysts believe the market will continue with the bear trend. I have found that Wave II usually retraces to 72% of the rise of Wave I, which means that the Dow can retrace to 7957 for a true Wave II count, but I have also seen a 100% retracement. |
| If my Elliott count is correct, the Dow could be making a Wave 2 bottom of a new bull market as this report is being written. To dampen the enthusiastic bulls though, my one fear is the time scale. It took the bullish impulse Wave count 67.5 years, from June 1932 to January 2000 (close to a fibonnaci ratio of 61.8). The bearish wave count of two years and 10 months, from January 2000 to October 2002 looks to be too short a time scale. Bear markets are thought to be 38.2% of a bull rise, which means the bear market should be 309 months (67 x 12 = 804 + 5 = 805 months. 805 x 38.2 = 309 months). The above is my primary count for the Dow at the moment. This means that I am looking for a new bull market to start as Wave 2 consolidates. My secondary chart follows the Nasdaq count made in my November 19th Traders.com article, which means that any bull market could be a bear trap. Let us hope not. |
Has been a technical analyst since 1969, and has worked as a futures and options trader with First Financial Futures in Johannesburg, South Africa.
| Address: | 3256 West 24th Ave |
| Vancouver, BC | |
| Phone # for sales: | 6042634214 |
| E-mail address: | petroosp@gmail.com |
Click here for more information about our publications!
Comments
Date: 02/10/03Rank: 4Comment:
Date: 02/11/03Rank: 4Comment:
Date: 02/11/03Rank: 4Comment:
Date: 02/25/03Rank: 4Comment:
Date: 03/03/03Rank: 5Comment:

|

Request Information From Our Sponsors
- StockCharts.com, Inc.
- Candle Patterns
- Candlestick Charting Explained
- Intermarket Technical Analysis
- John Murphy on Chart Analysis
- John Murphy's Chart Pattern Recognition
- John Murphy's Market Message
- MurphyExplainsMarketAnalysis-Intermarket Analysis
- MurphyExplainsMarketAnalysis-Visual Analysis
- StockCharts.com
- Technical Analysis of the Financial Markets
- The Visual Investor
- VectorVest, Inc.
- Executive Premier Workshop
- One-Day Options Course
- OptionsPro
- Retirement Income Workshop
- Sure-Fire Trading Systems (VectorVest, Inc.)
- Trading as a Business Workshop
- VectorVest 7 EOD
- VectorVest 7 RealTime/IntraDay
- VectorVest AutoTester
- VectorVest Educational Services
- VectorVest OnLine
- VectorVest Options Analyzer
- VectorVest ProGraphics v6.0
- VectorVest ProTrader 7
- VectorVest RealTime Derby Tool
- VectorVest Simulator
- VectorVest Variator
- VectorVest Watchdog
