HOT TOPICS LIST
- MACD
- Fibonacci
- RSI
- Gann
- ADXR
- Stochastics
- Volume
- Triangles
- Futures
- Cycles
- Volatility
- ZIGZAG
- MESA
- Retracement
- Aroon
INDICATORS LIST
LIST OF TOPICS
PRINT THIS ARTICLE
by Koos van der Merwe
I discovered Elliott wave theory in 1969, and since then have been hooked. Has Elliott made money for me? No, but it has forewarned me of what to expect in the future, and that helps, but only if I accept what it tells me. That is difficult most of the time, as you will find out in the following analysis.
I discovered Kondratieff at more or less the same time, and have successfully used it to time my long-term Elliott forecasts. Here is how I do it.
Position: Accumulate
Koos van der Merwe
Has been a technical analyst since 1969, and has worked as a futures and options trader with First Financial Futures in Johannesburg, South Africa.
PRINT THIS ARTICLE
ELLIOTT WAVE
The Nasdaq: Elliott Wave and Kondratieff
11/19/02 12:40:58 PMby Koos van der Merwe
I discovered Elliott wave theory in 1969, and since then have been hooked. Has Elliott made money for me? No, but it has forewarned me of what to expect in the future, and that helps, but only if I accept what it tells me. That is difficult most of the time, as you will find out in the following analysis.
I discovered Kondratieff at more or less the same time, and have successfully used it to time my long-term Elliott forecasts. Here is how I do it.
Position: Accumulate
| Classic Elliott states that the market moves up in three impulse waves and two corrective waves. The impulse waves are waves 1, 3 and 5. The corrective waves are 2 and 4. The basic Elliott rules are very simple: 1. The chart must look right. 2. Wave 3 is usually 1.618 of Wave 1. 3. Wave 1 and Wave 5 are equal in length. 4. If Wave 2 is a simple wave, then Wave 4 is a complicated wave. 5. Wave 5 is followed by an ABC correction with Wave A being a 3 wave abc down, Wave C being a 5 wave correction down and Wave B being an ABCxABCxABC etc., up. 6. The ABC correction must end within the fourth Wave of lesser degree. |
| Now having stated this, there are many, many variations to the classical theory. Books have been written and rewritten on Wave theory, and all begin with the simple basics, adding their own variations, some simple, others extremely complicated. Because of these variations, most Elliotticians will have an alternate chart up their sleeve, 'just in case.' I have always looked for the simple and obvious. Here are a few of my own variations: 1. if Wave 3 is smaller than Wave 1, then Wave 5 must be smaller than Wave 3. When this variation occurs in a rising market, it indicates tremendous weakness, and in a falling market, tremendous strength. I have seen this pattern in action on more than one occasion since becoming a student of Elliott. 2. If wave A is a 5 impulse wave down, then wave B will be an ABC up, and wave C will be a 5 impulse wave down. This pattern is indicative of a true bear market and not just a correction to a bull market. |

|
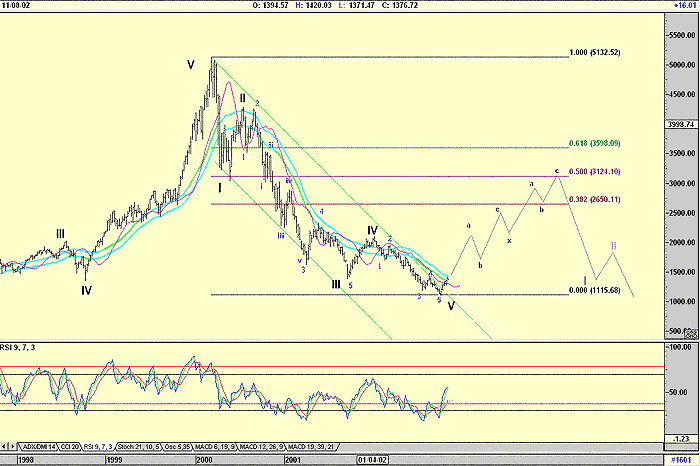
| Figure 1: My Elliott wave prediction and current wave count. |
| Graphic provided by: AdvancedGET. |
| |
| The chart above shows the second variation I have listed above, with WAVE V down being the completion of WAVE A - and this is scary - because it means that the Nasdaq Index may, for the next few years, be very volatile as the B-Wave up is in action, with a major collapse some time in the future. |
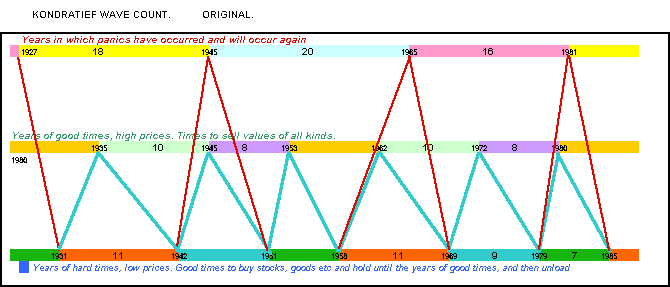
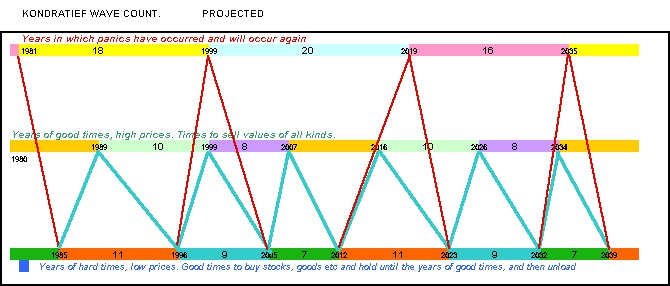
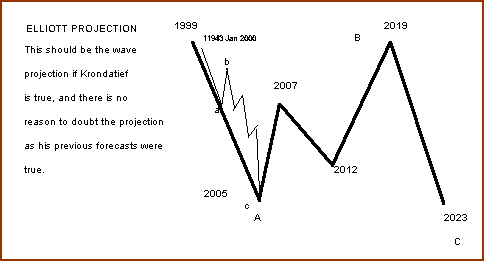
| The chart also shows my expected projection of the above, and is my preferred count at present. Will the Nasdaq behave as projected in the chart? I don't know, but I do know that political events throughout the world are suggesting this is a very real possibility. Elliott is telling me that the next few years will be a trader's market, leading to a bear trap, where investors believe that the glory days of 2000 are back as the market rises. Instead of the ABCxABC pattern I have suggested above, the Nasdaq could follow a 5-wave up, 3-wave down, and 5-wave up pattern of a ABC cycle. This is far less volatile than the pattern I have suggested. But whatever the pattern, once Wave B is complete, there will be a major collapse in a 5 impulse WAVE C. As to the time scale for the end of wave B? Krondatieff suggests 2007 give or take a year, with the end of WAVE C probably 2012. To predict the turning point of a WAVE B is and has always been difficult. The year 2023 is also the year for a Krondatieff wave bottom. My second chart is therefore a Krondatieff chart, nicely annotated. |
   As you can see, the chart was off by one year in calling for the market top in the year 2000. It is also calling for the present cycle to end in 2012 with the B-Wave topping out in 2007. It also suggests that 2005 will see an end to the present down move, and allowing a year for error, suggests that the bottom called by Nasdaq (end of Wave C) may not be true, that more downside could occur. I am inclined to accept Elliott above Krondatieff. I believe that the market is in a B-WAVE up as outlined in the Nasdaq chart. I also believe that the market, for the next few years, may move between years of hard times and years of good times. Years of panic (a bubble) could only occur again in the year 2023. So for the next few years enjoy the market. Krondatieff is saying 'go for it' The Nasdaq is saying , 'I agree but with caution.' |
Has been a technical analyst since 1969, and has worked as a futures and options trader with First Financial Futures in Johannesburg, South Africa.
| Address: | 3256 West 24th Ave |
| Vancouver, BC | |
| Phone # for sales: | 6042634214 |
| E-mail address: | petroosp@gmail.com |
Click here for more information about our publications!
Comments
Date: 11/21/02Rank: 5Comment:
Date: 11/21/02Rank: 5Comment:
Date: 11/22/02Rank: 4Comment: good article from long term perspective.
But what has happened Andrew Harrington! No articles! would u care to respond
Date: 11/26/02Rank: 5Comment:
Date: 11/26/02Rank: 5Comment:
Date: 11/27/02Rank: 5Comment:

Request Information From Our Sponsors
- StockCharts.com, Inc.
- Candle Patterns
- Candlestick Charting Explained
- Intermarket Technical Analysis
- John Murphy on Chart Analysis
- John Murphy's Chart Pattern Recognition
- John Murphy's Market Message
- MurphyExplainsMarketAnalysis-Intermarket Analysis
- MurphyExplainsMarketAnalysis-Visual Analysis
- StockCharts.com
- Technical Analysis of the Financial Markets
- The Visual Investor
- VectorVest, Inc.
- Executive Premier Workshop
- One-Day Options Course
- OptionsPro
- Retirement Income Workshop
- Sure-Fire Trading Systems (VectorVest, Inc.)
- Trading as a Business Workshop
- VectorVest 7 EOD
- VectorVest 7 RealTime/IntraDay
- VectorVest AutoTester
- VectorVest Educational Services
- VectorVest OnLine
- VectorVest Options Analyzer
- VectorVest ProGraphics v6.0
- VectorVest ProTrader 7
- VectorVest RealTime Derby Tool
- VectorVest Simulator
- VectorVest Variator
- VectorVest Watchdog
