HOT TOPICS LIST
- MACD
- Fibonacci
- RSI
- Gann
- ADXR
- Stochastics
- Volume
- Triangles
- Futures
- Cycles
- Volatility
- ZIGZAG
- MESA
- Retracement
- Aroon
INDICATORS LIST
LIST OF TOPICS
PRINT THIS ARTICLE
by Koos van der Merwe
SPIDERS (SPY) or SPDRs are the first index shares created by Amex and introduced in 1993. They are Standard & Poor's Depository Receipts and as such, reflect the movement of the S&P Index. They trade just like common stock under the symbol SPY, and pay dividends, but unlike stocks, they can be shorted on downticks. This enhances their liquidity.
Position: Hold
Koos van der Merwe
Has been a technical analyst since 1969, and has worked as a futures and options trader with First Financial Futures in Johannesburg, South Africa.
PRINT THIS ARTICLE
MOVING AVERAGES
A Look at Spiders Using the Red/Green Strategy
02/05/03 01:22:26 PMby Koos van der Merwe
SPIDERS (SPY) or SPDRs are the first index shares created by Amex and introduced in 1993. They are Standard & Poor's Depository Receipts and as such, reflect the movement of the S&P Index. They trade just like common stock under the symbol SPY, and pay dividends, but unlike stocks, they can be shorted on downticks. This enhances their liquidity.
Position: Hold
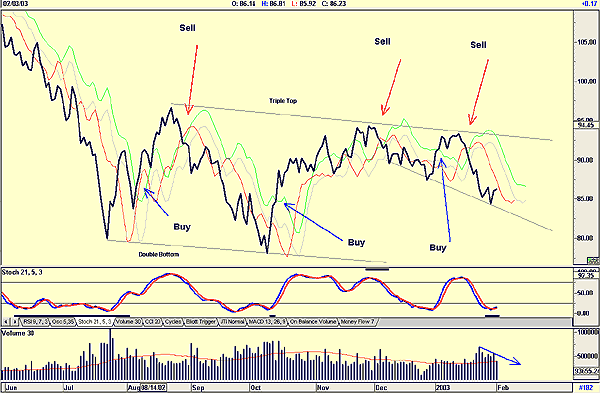
| A look at the chart of Spiders shows the following: 1. A double bottom formed suggesting strength. This materialized, and the SPDRS rose to the resistance trendline as shown. 2. The resistance line has proved itself, but the share, instead of falling dramatically, as suggested by both the stochastic and the resistance line itself (all other indicators such as the RSI also show an overbought position) appears to be sticking closely to the upper resistance line. 3. The chart also shows that a triple top has formed. The upper trendline has now become a very strong resistance level. 4. Finally, volume has been falling as the SPDRS fell, a sign of strength. |
| Looking at the Red/Green trading strategy (Red/Green Trading Strategy - 30th September 2002), the green line is a one-day moving average of the high of the daily move offset forward by 10 days. A break through the green line moving upwards with the indicator moving up from an oversold position constitutes a BUY as shown. The gray line is a 1-day moving average of the low of the daily move, offset forward by 10 days. A break through the gray line moving upwards with the indicator moving up from an oversold position constitutes and early warning BUY signal. The red line is a 1-day moving average of the low of the daily move offset forward by six days. A break through the red line, moving downwards with the indicator moving downwards from an overbought position constitutes a SELL signal. You would close a position either on a stop-loss or on a break of any of the lines in an opposite direction to the BUY/SELL signals mentioned above. In other words, I would close a BUY position if the SPIDERS moved below the green line or broke below the red line, whichever came first. |

|
| Figure 1: SPIDERS... showing future strength? |
| Graphic provided by: AdvancedGET. |
| |
| At the moment you would be short SPDRS as shown in the chart, but the oversold position of the stochastic, and the suggestion that if the market strengthens, the SPDRS could break through the red line from below, suggests that one could close out the position with any strong upmove. A break through the green line would be a new BUY. |
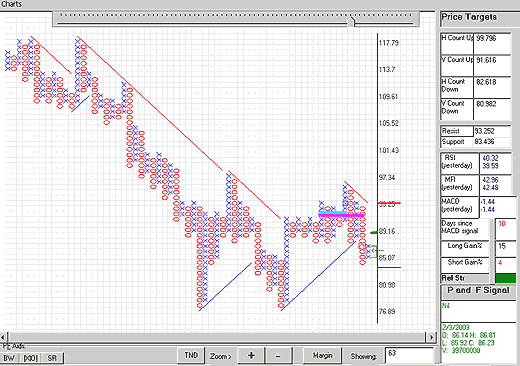
 Figure 2: SPDRS point and figure chart. A point and figure chart is still bearish and showing a retracement in the bear trend, with a buy signal only at the 33.25 level. Should the SPDRS break above this level, the horizontal target count is suggesting an up target of 99.796. At the moment, the down target of 82.618 is more likely. |
| The SPDRS appears to be reflecting an underlying strength in the market that will happen once the political uncertainty depressing the market is resolved. A break through the resistance line/triple top would see a target of 99.796 as determined using the point and figure horizontal count. Bottom pickers could start taking positions once the red line is broken. More cautious traders would wait until a definite buy signal has been given, such as a break through the green line. |
Has been a technical analyst since 1969, and has worked as a futures and options trader with First Financial Futures in Johannesburg, South Africa.
| Address: | 3256 West 24th Ave |
| Vancouver, BC | |
| Phone # for sales: | 6042634214 |
| E-mail address: | petroosp@gmail.com |
Click here for more information about our publications!
Comments
Date: 02/11/03Rank: 2Comment:

Request Information From Our Sponsors
- StockCharts.com, Inc.
- Candle Patterns
- Candlestick Charting Explained
- Intermarket Technical Analysis
- John Murphy on Chart Analysis
- John Murphy's Chart Pattern Recognition
- John Murphy's Market Message
- MurphyExplainsMarketAnalysis-Intermarket Analysis
- MurphyExplainsMarketAnalysis-Visual Analysis
- StockCharts.com
- Technical Analysis of the Financial Markets
- The Visual Investor
- VectorVest, Inc.
- Executive Premier Workshop
- One-Day Options Course
- OptionsPro
- Retirement Income Workshop
- Sure-Fire Trading Systems (VectorVest, Inc.)
- Trading as a Business Workshop
- VectorVest 7 EOD
- VectorVest 7 RealTime/IntraDay
- VectorVest AutoTester
- VectorVest Educational Services
- VectorVest OnLine
- VectorVest Options Analyzer
- VectorVest ProGraphics v6.0
- VectorVest ProTrader 7
- VectorVest RealTime Derby Tool
- VectorVest Simulator
- VectorVest Variator
- VectorVest Watchdog
