HOT TOPICS LIST
- MACD
- Fibonacci
- RSI
- Gann
- ADXR
- Stochastics
- Volume
- Triangles
- Futures
- Cycles
- Volatility
- ZIGZAG
- MESA
- Retracement
- Aroon
INDICATORS LIST
LIST OF TOPICS
PRINT THIS ARTICLE
by Matt Blackman
A Dow head & shoulder top pattern that began forming in 1998 is approaching completion. If it follows through, the prognosis for a near-term recovery in markets looks bleak. I also discuss an interesting tool for MetaStock users to help identify possible reversal points.
Position: N/A
Matt Blackman
Matt Blackman is a full-time technical and financial writer and trader. He produces corporate and financial newsletters, and assists clients in getting published in the mainstream media. He is the host of TradeSystemGuru.com. Matt has earned the Chartered Market Technician (CMT) designation. Find out what stocks and futures Matt is watching on Twitter at www.twitter.com/RatioTrade
PRINT THIS ARTICLE
HEAD & SHOULDERS
Dow Update
01/28/03 12:11:44 PMby Matt Blackman
A Dow head & shoulder top pattern that began forming in 1998 is approaching completion. If it follows through, the prognosis for a near-term recovery in markets looks bleak. I also discuss an interesting tool for MetaStock users to help identify possible reversal points.
Position: N/A
| Bearish head & shoulders top (HST) patterns formed weeks ago in both the S&P 500 Index ($SPX) and the Standard & Poor's Deposits-Receipts (SPY) (see The Critical Head & Shoulders Test - Working Money, 11/12/02). The one major index that had not followed suit (with a horizontal HST) was the Dow ($INDU) but it looks like its days outside this camp may be numbered. |
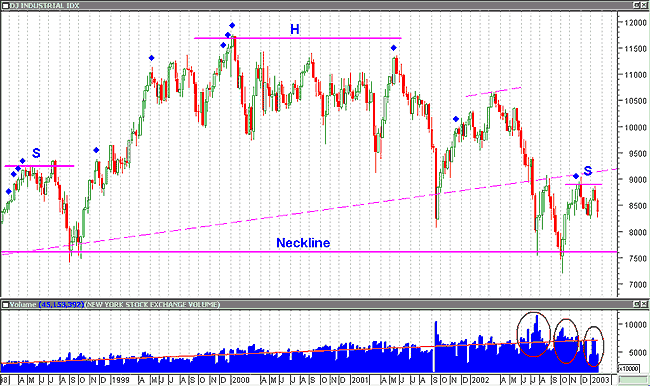
 Figure 1 - Weekly Dow Industrial chart ($INDU) showing NYSE volume. (Chart provided by MetaStock.) The complex HST pattern shows volume increases as the index drops around the right shoulder, which is bearish. To complete the shoulder, look for the index to drop to below 7,700 in mid- to late February or early March on increasing volume. Also note the blue diamonds indicating bearish engulfing patterns using the Metastock Nison Candlesticks Unleashed (NCU) plug-in. I have found it helpful in identifying price turning points. It is interesting to note that a diagonal HST pattern formed using the top of 10,600 near end of March 2002 as the right shoulder (see dashed magenta lines in Figure 1). However, the new pattern if it forms, will be even more bearish. On the bright side, for MetaStock users I have found the Steve Nison's Candlesticks Unleashed (NCU) plug-in to be a great aid in identifying potential reversal points in my trading analysis. It works for both end-of-day and intraday data. Weekly signals are better at spotting longer-term reversals. I use the NCU Experts (as discussed in Figures 1 and 2) and Explorations to locate potential trading candidates. |

|
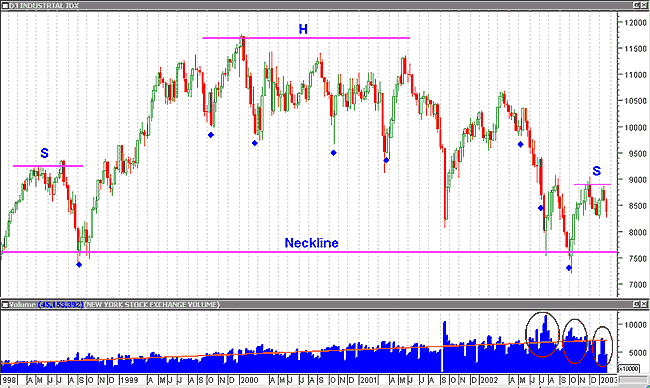
| Figure 2 – Weekly Dow Industrial Average ($INDU) again with HST pattern but this time showing the bullish engulfing patterns (blue diamonds) identified by the Metastock NCU plug in. It has been quite reliable at picking out reversal points. |
| Graphic provided by: MetaStock. |
| |
| Two smaller HST patterns identified on the daily chart of the Dow Jones Industrial Average performed as expected, topping out at 8,800 and then penetrating the neckline at 8,350 (see "Dow Deja Vu" - TA 01/02/03). Even if the right shoulder forms as expected and the neckline at 7,600-7,700 is broken, the Dow will have to continue dropping on increasing volume to confirm the pattern. If the neckline is not broken (and the index fails to drop to 7,700) or if it is but the Dow rallies and convincingly breaks the neckline as it rallies back towards 9,000, all bearish bets are off. However, a continued decline in the value of the US dollar would not be good for the Dow or US markets in general, making a rally back to 9,000 a long shot. |
Matt Blackman is a full-time technical and financial writer and trader. He produces corporate and financial newsletters, and assists clients in getting published in the mainstream media. He is the host of TradeSystemGuru.com. Matt has earned the Chartered Market Technician (CMT) designation. Find out what stocks and futures Matt is watching on Twitter at www.twitter.com/RatioTrade
| Company: | TradeSystemGuru.com |
| Address: | Box 2589 |
| Garibaldi Highlands, BC Canada | |
| Phone # for sales: | 604-898-9069 |
| Fax: | 604-898-9069 |
| Website: | www.tradesystemguru.com |
| E-mail address: | indextradermb@gmail.com |
Traders' Resource Links | |
| TradeSystemGuru.com has not added any product or service information to TRADERS' RESOURCE. | |
Click here for more information about our publications!
Comments
Date: 01/28/03Rank: 5Comment:
Date: 01/29/03Rank: 4Comment:
Date: 01/31/03Rank: 5Comment:
Date: 02/04/03Rank: 5Comment:

|

Request Information From Our Sponsors
- StockCharts.com, Inc.
- Candle Patterns
- Candlestick Charting Explained
- Intermarket Technical Analysis
- John Murphy on Chart Analysis
- John Murphy's Chart Pattern Recognition
- John Murphy's Market Message
- MurphyExplainsMarketAnalysis-Intermarket Analysis
- MurphyExplainsMarketAnalysis-Visual Analysis
- StockCharts.com
- Technical Analysis of the Financial Markets
- The Visual Investor
- VectorVest, Inc.
- Executive Premier Workshop
- One-Day Options Course
- OptionsPro
- Retirement Income Workshop
- Sure-Fire Trading Systems (VectorVest, Inc.)
- Trading as a Business Workshop
- VectorVest 7 EOD
- VectorVest 7 RealTime/IntraDay
- VectorVest AutoTester
- VectorVest Educational Services
- VectorVest OnLine
- VectorVest Options Analyzer
- VectorVest ProGraphics v6.0
- VectorVest ProTrader 7
- VectorVest RealTime Derby Tool
- VectorVest Simulator
- VectorVest Variator
- VectorVest Watchdog
