HOT TOPICS LIST
- MACD
- Fibonacci
- RSI
- Gann
- ADXR
- Stochastics
- Volume
- Triangles
- Futures
- Cycles
- Volatility
- ZIGZAG
- MESA
- Retracement
- Aroon
INDICATORS LIST
LIST OF TOPICS
PRINT THIS ARTICLE
by Matt Blackman
One confirmed and one potential head & shoulders top pattern provide some guidance as to where markets may be headed in January-February.
Position: N/A
Matt Blackman
Matt Blackman is a full-time technical and financial writer and trader. He produces corporate and financial newsletters, and assists clients in getting published in the mainstream media. He is the host of TradeSystemGuru.com. Matt has earned the Chartered Market Technician (CMT) designation. Find out what stocks and futures Matt is watching on Twitter at www.twitter.com/RatioTrade
PRINT THIS ARTICLE
HEAD & SHOULDERS
Dow Deja Vu
01/02/03 09:19:35 AMby Matt Blackman
One confirmed and one potential head & shoulders top pattern provide some guidance as to where markets may be headed in January-February.
Position: N/A
| When it comes to markets, the saying "there is nothing new under the sun" rings true time and again. And sometimes this repetition occurs in rapid succession as is demonstrated by recent back-to-back head & shoulders top (HST) patterns with the Dow Jones Industrial Average ($INDU). |
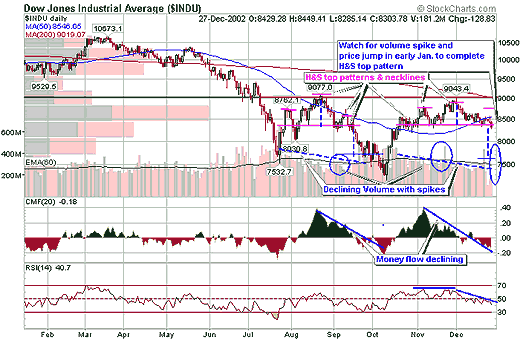
| The art of technical analysis is solidly based on probability, meaning that patterns occurring in the past have a greater chance of reaching a similar outcome in the future than not. This principle can be very useful for the trader in determining probable price movements. Figure 1 demonstrates mirror image HST patterns with the Dow Jones Industrial Average. In a classic head and shoulders top (HST) pattern, the security is predicted to drop from the neckline an amount equal to or greater than the distance from the neckline to the head (see blue vertical dashed lines). The first (left) HST pattern with a head of 9,077 points operated as predicted. After failing to rise above the neckline in September thereby confirming the pattern, the index dropped more than the predicted value of 7,700 (thin horizontal blue line) closing at a low of 7,286 on October 9, 2002. |

|
| Figure 1 – Daily Dow Jones Industrial Average showing confirmed and potential HST patterns complete with volume declines and spikes, as well as probable target prices. |
| Graphic provided by: StockCharts.com. |
| |
| What looks to be a second HST pattern began forming with a left shoulder of 8,700 and a head of 9,043. As with the first HST, volume declined over the duration of the pattern and volume spiked in most of the right places. Also note that Chaikin Money Flow declined through both patterns confirming that money is moving out of the NYSE. While the second HST has yet to be confirmed, experienced traders will be watching for a number of crucial steps to see if it forms as expected:
|
| It is too early to call the second pattern a head & shoulders top pattern but the fact that a similar pattern has formed and that it is 75% complete suggests that the probability is high that it will be confirmed. It is also interesting to note that the move back up to a right shoulder would furnish a much anticipated early January rally. However, knowing that a HST pattern is probable provides advanced warning to those in the know who will not to be fooled into believing that the sustainable rally is underway until the major resistance level at 9,000 is broken and holds as support. |
Matt Blackman is a full-time technical and financial writer and trader. He produces corporate and financial newsletters, and assists clients in getting published in the mainstream media. He is the host of TradeSystemGuru.com. Matt has earned the Chartered Market Technician (CMT) designation. Find out what stocks and futures Matt is watching on Twitter at www.twitter.com/RatioTrade
| Company: | TradeSystemGuru.com |
| Address: | Box 2589 |
| Garibaldi Highlands, BC Canada | |
| Phone # for sales: | 604-898-9069 |
| Fax: | 604-898-9069 |
| Website: | www.tradesystemguru.com |
| E-mail address: | indextradermb@gmail.com |
Traders' Resource Links | |
| TradeSystemGuru.com has not added any product or service information to TRADERS' RESOURCE. | |
Click here for more information about our publications!
Comments
Date: 01/14/03Rank: 5Comment: educational observation.

Request Information From Our Sponsors
- StockCharts.com, Inc.
- Candle Patterns
- Candlestick Charting Explained
- Intermarket Technical Analysis
- John Murphy on Chart Analysis
- John Murphy's Chart Pattern Recognition
- John Murphy's Market Message
- MurphyExplainsMarketAnalysis-Intermarket Analysis
- MurphyExplainsMarketAnalysis-Visual Analysis
- StockCharts.com
- Technical Analysis of the Financial Markets
- The Visual Investor
- VectorVest, Inc.
- Executive Premier Workshop
- One-Day Options Course
- OptionsPro
- Retirement Income Workshop
- Sure-Fire Trading Systems (VectorVest, Inc.)
- Trading as a Business Workshop
- VectorVest 7 EOD
- VectorVest 7 RealTime/IntraDay
- VectorVest AutoTester
- VectorVest Educational Services
- VectorVest OnLine
- VectorVest Options Analyzer
- VectorVest ProGraphics v6.0
- VectorVest ProTrader 7
- VectorVest RealTime Derby Tool
- VectorVest Simulator
- VectorVest Variator
- VectorVest Watchdog
