

HOT TOPICS LIST
- MACD
- Fibonacci
- RSI
- Gann
- ADXR
- Stochastics
- Volume
- Triangles
- Futures
- Cycles
- Volatility
- ZIGZAG
- MESA
- Retracement
- Aroon
INDICATORS LIST
LIST OF TOPICS
PRINT THIS ARTICLE
by Mark Rivest
Elliott wave pattern implies rising Crude oil prices.
Position: Buy
Mark Rivest
Independent investment advisor, trader and writer. He has written articles for Technical Analysis of Stocks & Commodities, Traders.com Advantage,Futuresmag.com and, Finance Magnates. Author of website Four Dimension Trading.
PRINT THIS ARTICLE
ELLIOTT WAVE
Crude Oil - Elliott Wave Projection
05/19/22 03:22:01 PMby Mark Rivest
Elliott wave pattern implies rising Crude oil prices.
Position: Buy
| Since April 2020 Crude oil has been in a powerful bull market that has as of March 2022 retraced over 83% of the prior twelve-year bear market. After the spike peak made March 7, 2022 price has declined. Has a new bear market begun? Perhaps, however long -term and short-term Elliott wave analysis indicates the recent drop could be just a pause in a still forming bull market. Long-term View Please see the monthly Crude oil futures (continuous:next contract in front) – Trading View symbol (CL2!) – chart illustrated in Figure 1. From the all-time high in July 2008 to April 2020 CL2! had formed an Elliott wave Double Zigzag pattern. Since April 2020 the bull move appears to be an extending five-wave Impulse pattern. My 07/15/21 article "US Stocks/Crude Oil Connection" illustrated that Crude oil had resistance in the area of 80.00 to 90.00. Subsequently Crude oil has pushed above this resistance. The all-time high at 147.90 could be the next resistance. |

|
| Figure 1. The all-time high at 147.90 could be the next resistance. |
| Graphic provided by: TradingView. |
| |
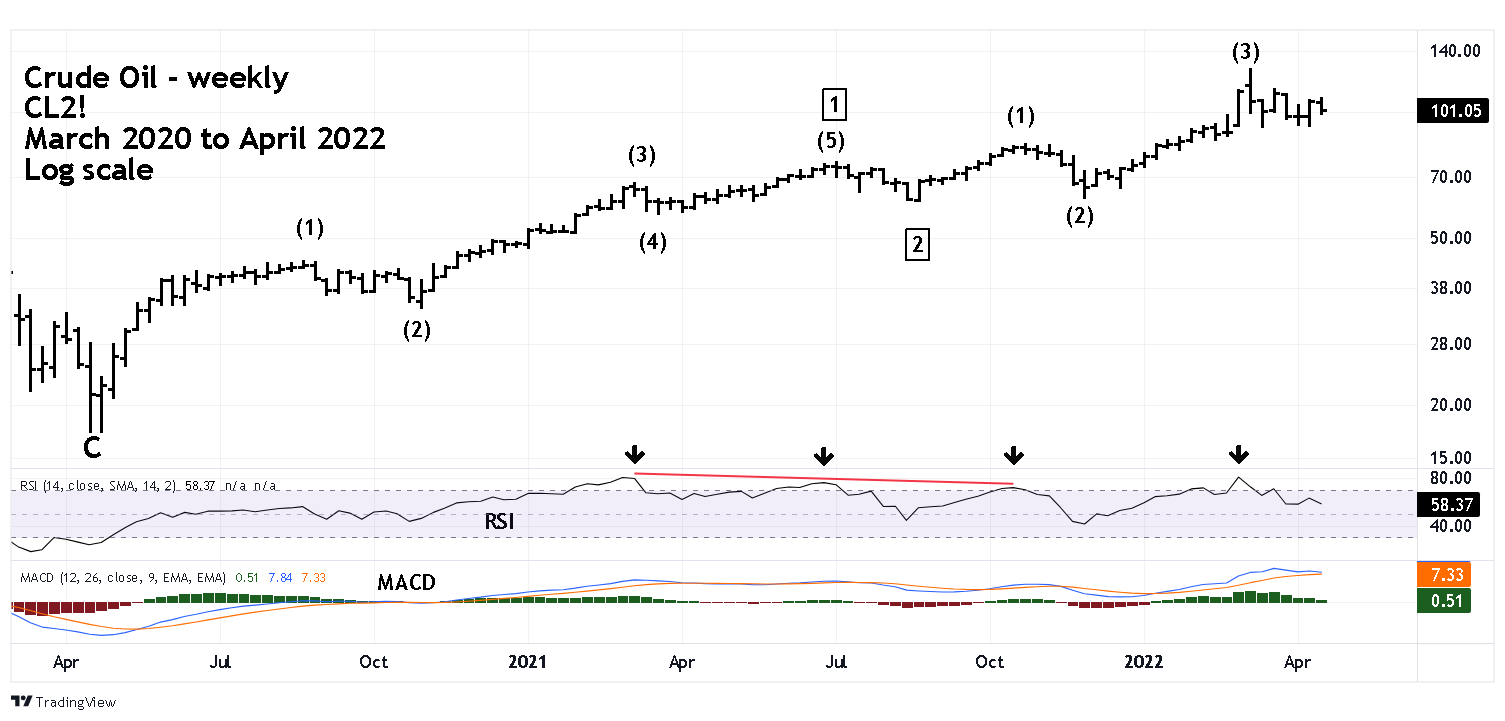
| Intermediate View Please see the weekly Crude oil chart illustrated in Figure 2. The move up from April 2020 to July 2021 counts as a clear five wave pattern that could be the first wave up of a larger developing five-wave movement. Three waves up from August 2021 to March 2022 could be three waves of the still developing Primary wave "3" boxed. Frequently when the RSI momentum indicator moves into the overbought zone above 70% it implies price could continue to rise. Note that in March 2021 RSI hit 80%, price reached a short-term top and later kept climbing while the RSI recorded a double bearish divergence. The February 2022 RSI reading of 80% could also be forecasting higher prices. |
|
| Figure 2. The move up from April 2020 to July 2021 counts as � a clear five wave pattern. |
| Graphic provided by: TradingView. |
| |
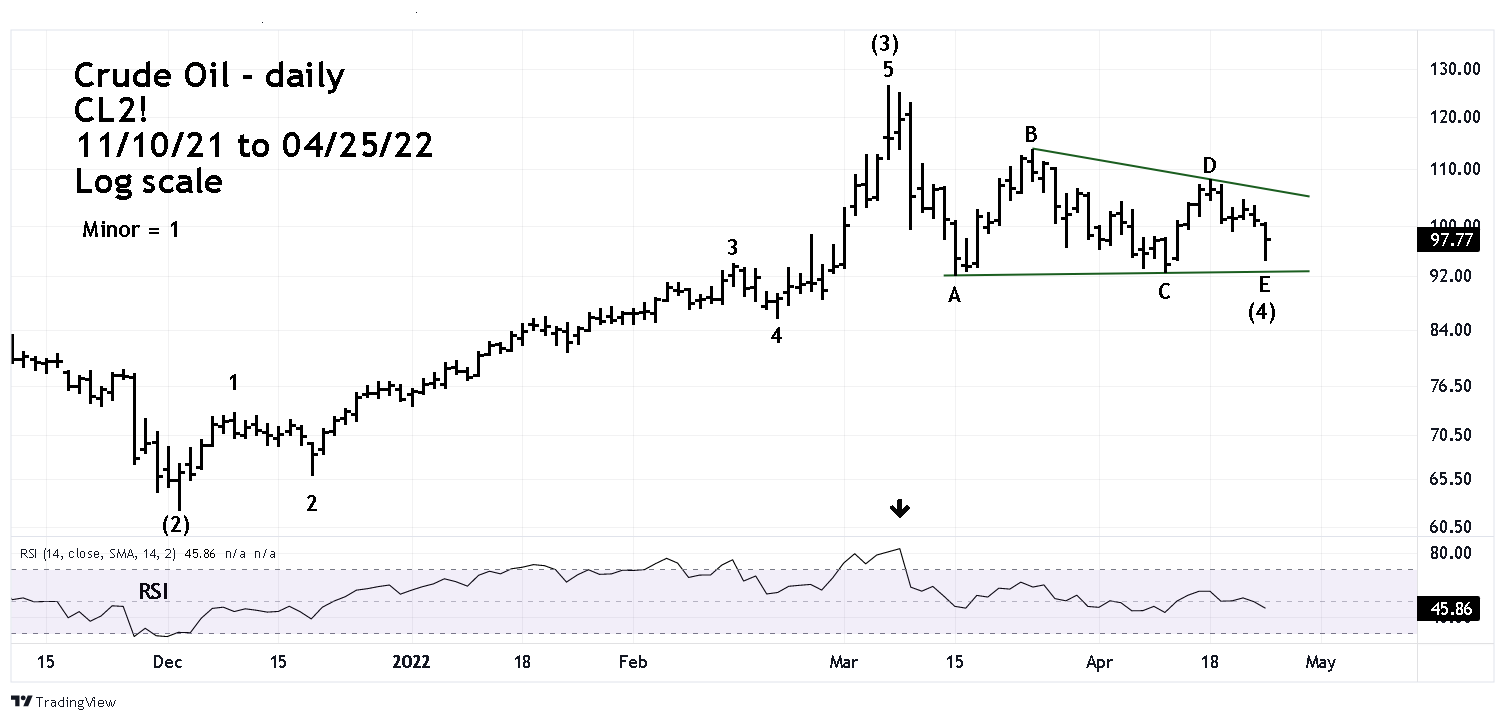
| Short-term View Please see the daily Crude oil chart illustrated in Figure 3. The rally from December 2021 to March 2022 also subdivides into five waves. Note that the daily RSI hit its maximum at the highest closing price level recorded on March 8, 2022. Subsequent to the March 2022 peak the movement going into April 25, 2022 appears to be an Elliott wave Horizontal Triangle. This is a corrective pattern that only occurs in the fourth wave position of motive waves and in the "B" wave position of corrective patterns. After a Horizontal Triangle is complete there's usually a thrust in the direction of the primary trend — in this case up. |
|
| Figure 3. After a Horizontal Triangle is � complete there's usually a thrust in the direction of the primary trend � in this case up. |
| Graphic provided by: TradingView. |
| |
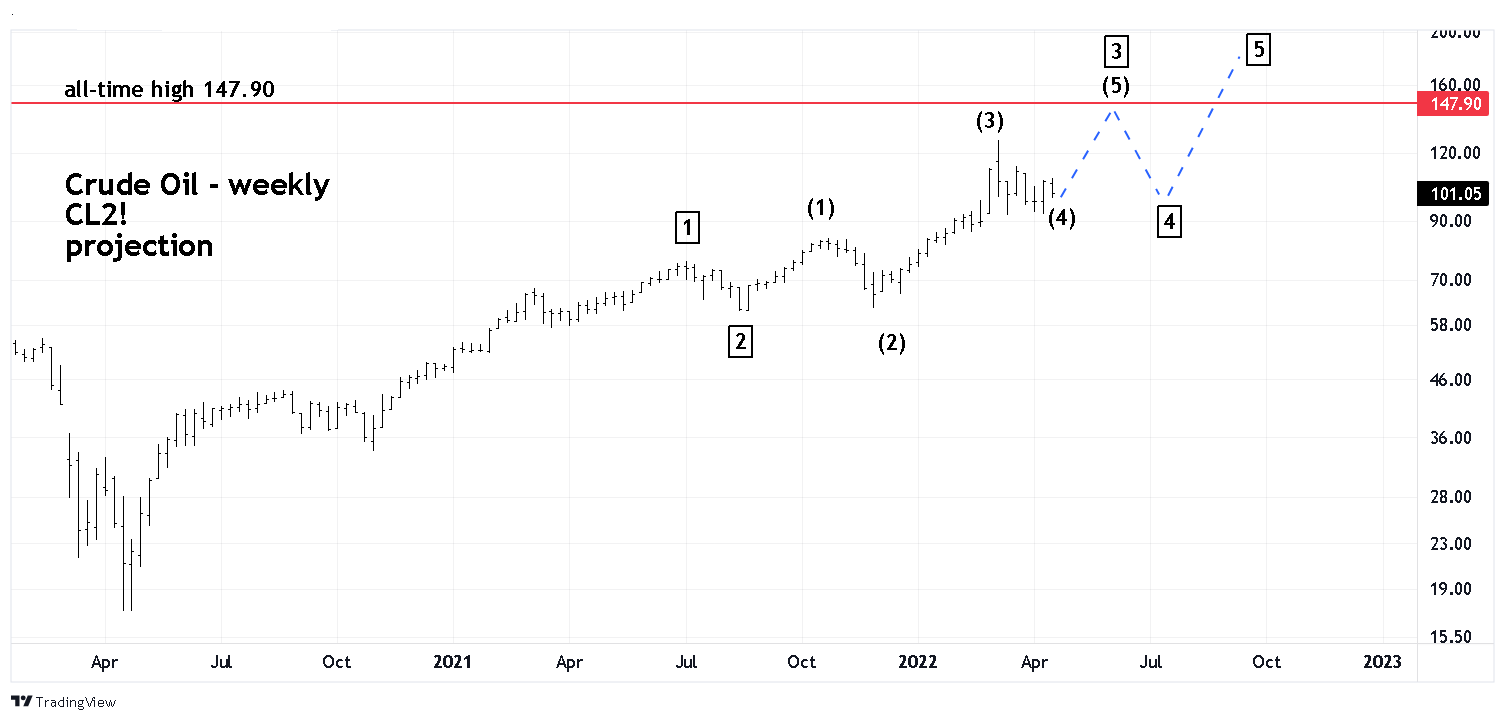
| Elliott wave Projection Please see the Crude oil projection chart illustrated in Figure 4. If there's a thrust up after the presumed Horizontal Triangle, the rally could terminate near the all-time high at 147.90. If price does stall in that area the next decline could be Primary wave "4". If so, fourth waves usually terminate in the area of the fourth wave of one lesser degree - which is the presumed Horizontal Triangle. When measuring markets that have had large percentage gains it's necessary to compare growth rates. On a Log scale chart, the presumed Primary wave "3" appears to be on track to be shorter than Primary wave "1". In Elliott wave theory the third wave in a five-wave motive pattern is never the shortest wave. Therefore, the presumed Primary wave "5" would be shorter than Primary wave "3", and projects a range of 148.00 to 190.00. Greater target precision could be achieved if Primary waves "3" and "4" develop. If CL2! moves below 92.20 it will invalidate the Horizontal Triangle and open the door for lower prices. If CL2! moves above 126.42 it could be the first clue that Primary wave "5" is in development. Further Reading: Frost A.J and Robert Prechter (1985) "Elliott Wave Principle", New Classics Library. |
|
| Figure 4. If CL2! moves above 126.42 it could be the first clue that Primary wave "5" is in development. |
| Graphic provided by: TradingView. |
| |
Independent investment advisor, trader and writer. He has written articles for Technical Analysis of Stocks & Commodities, Traders.com Advantage,Futuresmag.com and, Finance Magnates. Author of website Four Dimension Trading.
| Website: | www.fourdimensiontrading.com |
| E-mail address: | markrivest@gmail.com |
Click here for more information about our publications!
PRINT THIS ARTICLE

Request Information From Our Sponsors
- VectorVest, Inc.
- Executive Premier Workshop
- One-Day Options Course
- OptionsPro
- Retirement Income Workshop
- Sure-Fire Trading Systems (VectorVest, Inc.)
- Trading as a Business Workshop
- VectorVest 7 EOD
- VectorVest 7 RealTime/IntraDay
- VectorVest AutoTester
- VectorVest Educational Services
- VectorVest OnLine
- VectorVest Options Analyzer
- VectorVest ProGraphics v6.0
- VectorVest ProTrader 7
- VectorVest RealTime Derby Tool
- VectorVest Simulator
- VectorVest Variator
- VectorVest Watchdog
- StockCharts.com, Inc.
- Candle Patterns
- Candlestick Charting Explained
- Intermarket Technical Analysis
- John Murphy on Chart Analysis
- John Murphy's Chart Pattern Recognition
- John Murphy's Market Message
- MurphyExplainsMarketAnalysis-Intermarket Analysis
- MurphyExplainsMarketAnalysis-Visual Analysis
- StockCharts.com
- Technical Analysis of the Financial Markets
- The Visual Investor