HOT TOPICS LIST
- MACD
- Fibonacci
- RSI
- Gann
- ADXR
- Stochastics
- Volume
- Triangles
- Futures
- Cycles
- Volatility
- ZIGZAG
- MESA
- Retracement
- Aroon
INDICATORS LIST
LIST OF TOPICS
PRINT THIS ARTICLE
by Mark Rivest
See why US stocks and Crude Oil could soon turn down.
Position: N/A
Mark Rivest
Independent investment advisor, trader and writer. He has written articles for Technical Analysis of Stocks & Commodities, Traders.com Advantage,Futuresmag.com and, Finance Magnates. Author of website Four Dimension Trading.
PRINT THIS ARTICLE
SEASONAL TRADING
US Stocks/Crude Oil Connection
07/15/21 04:47:29 PMby Mark Rivest
See why US stocks and Crude Oil could soon turn down.
Position: N/A
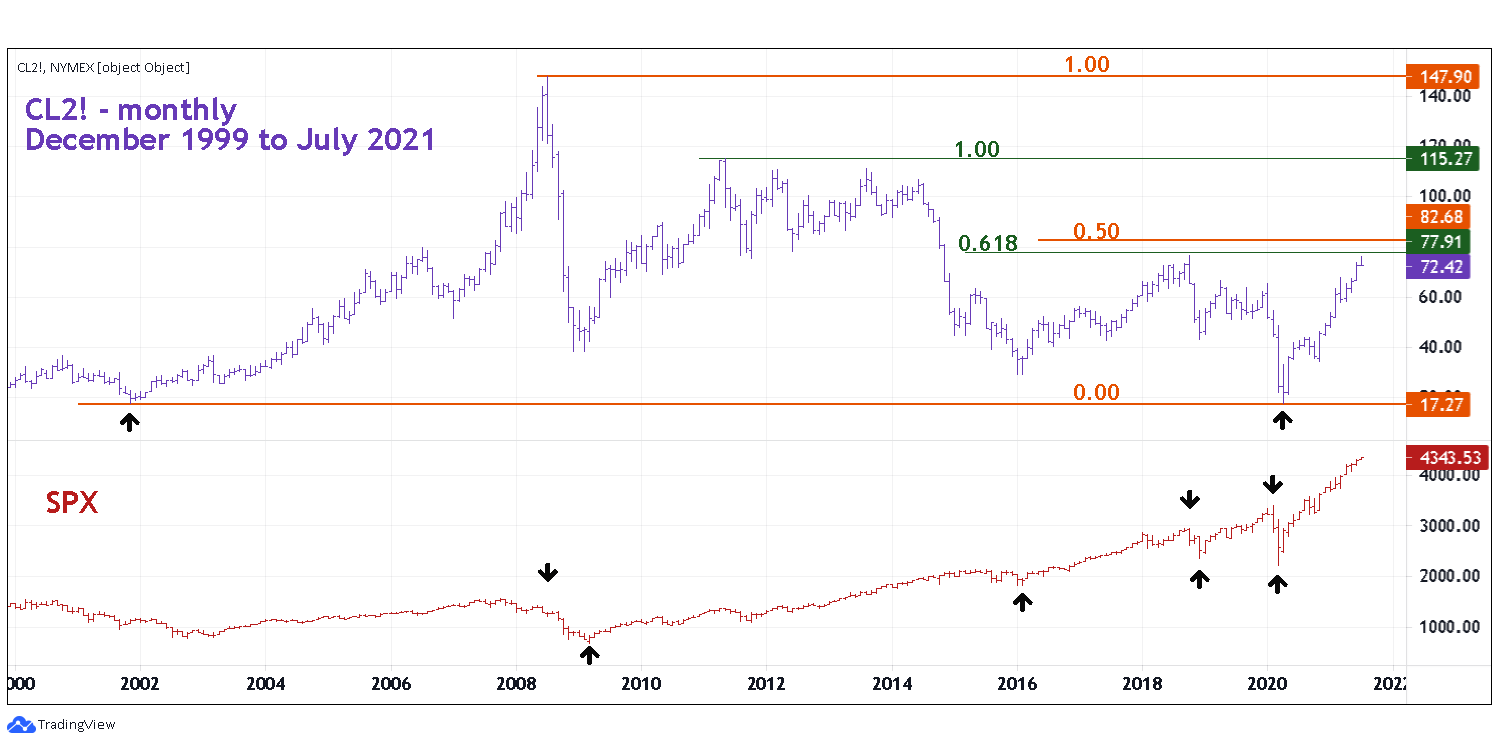
| Occasionally two markets can trend together. Since April of 2020 US stocks represented by the S&P 500 (SPX) have been in a bull trend along with Crude Oil. Seasonal patterns and deteriorating momentum hint that both markets could soon begin a multi-month decline. Crude Oil/SPX - Monthly My 03/25/21 article "Crude Oil Seasonal Bottoms - Part Two" noted that Crude Oil was in a bull trend that could climax in April. Subsequently, Crude Oil continued rising during the seasonally bearish months of May and June and is now poised for a potential top in August. If this develops seasonal patterns imply a decline into December. Please see the monthly chart of Crude Oil Futures (Continuous next contract in front) symbol (CL2!) and SPX- illustrated in Figure 1. Note the colossal twelve-year Crude Oil bear market ended almost at the exact same price as the bottom made in November 2001. The other arrows on the SPX chart illustrate points at which both markets made significant turns. As of 07/06/21 CL2! was nearing what could be important Fibonacci resistance, .50 retrace of the entire bear market at 82.68 and 77.91 a .618 retrace of the move down from the 2010 top. |

|
| Figure 1. The arrows on the SPX chart illustrate points at which both markets made significant turns. |
| Graphic provided by: TradingView. |
| |
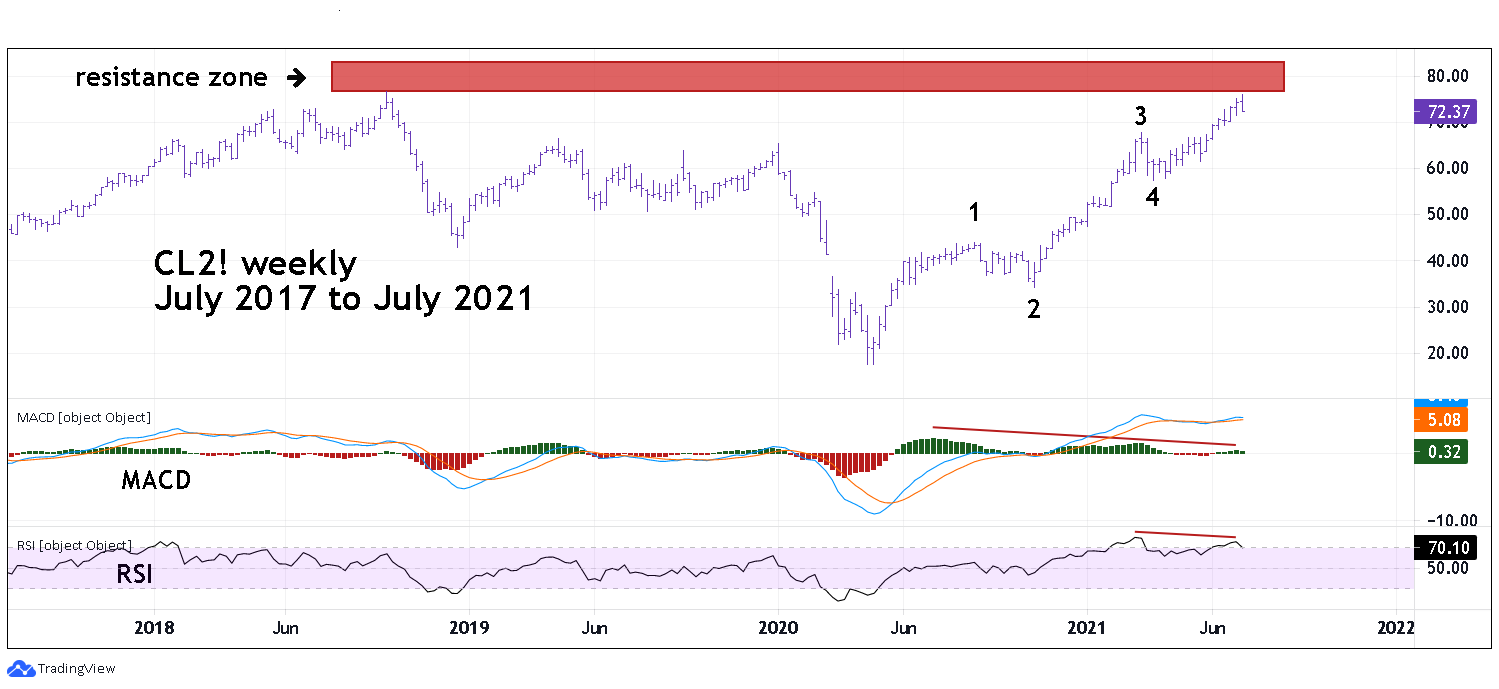
| Crude Oil - Weekly Please see the weekly CL2! chart illustrated in Figure 2. In addition to the two Fibonacci resistance points there's also chart resistance at 76.72 — the October 2018 peak. The high on 07/06/21 was 76.07 and could be an important top. If so, it's coming nearly a month before what's usually a seasonal top in August. The rally since the April 2020 bottom has taken the form of a clear Elliott five-wave impulse pattern. The rally since March 2021 is probably the fifth and final wave up. After completion of five waves up Crude Oil could enter a multi-month decline. This fits in with seasonal patterns that are usually bearish August to December. Weekly RSI has a bearish divergence and weekly MACD - Histogram has a double bearish divergence. If Crude Oil has not registered an important peak on 07/06/21 it could top very soon. |

|
| Figure 2. The rally since the April 2020 bottom has taken the form of a clear Elliott five–wave impulse pattern. |
| Graphic provided by: TradingView. |
| |
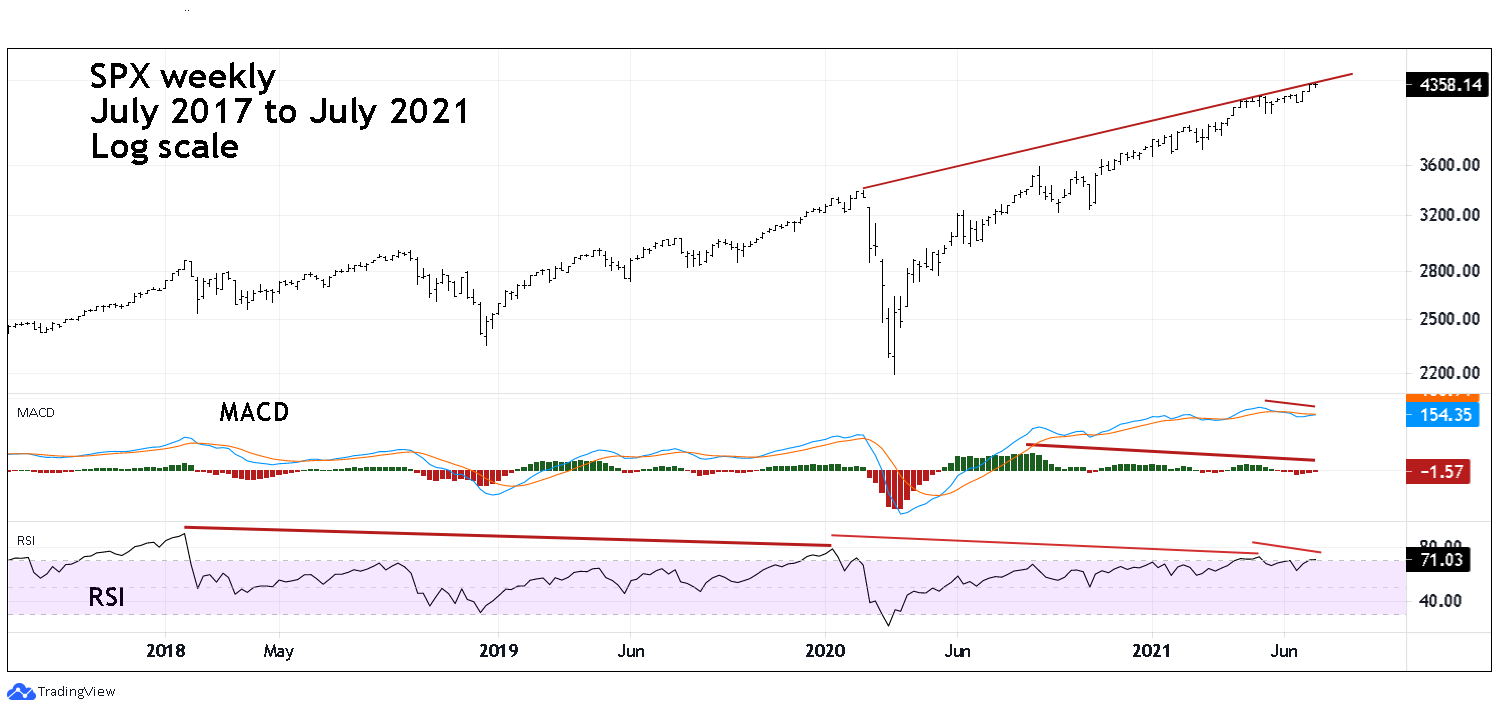
| S&P 500 - Weekly Please see the weekly SPX chart illustrated in Figure 3. The SPX momentum in early July is very bearish. Weekly RSI had a triple bearish divergence. Weekly MACD lines are bearish and MACD - Histogram has several bearish divergences. For several weeks price has been hugging the rising trend line from the February 2020 peak. US stocks usually have seasonal peaks late April/early May. When the stock indices continue to rally through May and June there can occasionally be a peak in August. The main bearish season for US stocks is from August to October, which corresponds with part of the Crude Oil bearish season — August to December. |

|
| Figure 3. Weekly RSI has a triple bearish divergence. |
| Graphic provided by: TradingView. |
| |
| Combined Top A peak for US stocks and Crude Oil may not be simultaneous, they could be separated by several weeks. Regardless of when potential tops could occur a Crude Oil decline implies economic weakness. As noted in several of my articles, the US secular bull market since March 2009 could be climaxing with the rally that began in March 2020. The SPX from March 2020 to July 2021 has rallied 98% and is one of the fastest and largest gains in the history of US stocks. A very steep stock market rally with weakening momentum and economy going into a seasonally bearish time could be the ingredients for a severe decline. October is notorious for large stock market declines, maybe a big drop could happen in October 2021. Further Reading: Frost A.J and Robert Prechter (1985) "Elliott Wave Principle", New Classics Library. |
Independent investment advisor, trader and writer. He has written articles for Technical Analysis of Stocks & Commodities, Traders.com Advantage,Futuresmag.com and, Finance Magnates. Author of website Four Dimension Trading.
| Website: | www.fourdimensiontrading.com |
| E-mail address: | markrivest@gmail.com |
Click here for more information about our publications!
PRINT THIS ARTICLE

Request Information From Our Sponsors
- VectorVest, Inc.
- Executive Premier Workshop
- One-Day Options Course
- OptionsPro
- Retirement Income Workshop
- Sure-Fire Trading Systems (VectorVest, Inc.)
- Trading as a Business Workshop
- VectorVest 7 EOD
- VectorVest 7 RealTime/IntraDay
- VectorVest AutoTester
- VectorVest Educational Services
- VectorVest OnLine
- VectorVest Options Analyzer
- VectorVest ProGraphics v6.0
- VectorVest ProTrader 7
- VectorVest RealTime Derby Tool
- VectorVest Simulator
- VectorVest Variator
- VectorVest Watchdog
- StockCharts.com, Inc.
- Candle Patterns
- Candlestick Charting Explained
- Intermarket Technical Analysis
- John Murphy on Chart Analysis
- John Murphy's Chart Pattern Recognition
- John Murphy's Market Message
- MurphyExplainsMarketAnalysis-Intermarket Analysis
- MurphyExplainsMarketAnalysis-Visual Analysis
- StockCharts.com
- Technical Analysis of the Financial Markets
- The Visual Investor
