

HOT TOPICS LIST
- MACD
- Fibonacci
- RSI
- Gann
- ADXR
- Stochastics
- Volume
- Triangles
- Futures
- Cycles
- Volatility
- ZIGZAG
- MESA
- Retracement
- Aroon
INDICATORS LIST
LIST OF TOPICS
PRINT THIS ARTICLE
by Mark Rivest
See why the Crude Oil rally could continue into April.
Position: N/A
Mark Rivest
Independent investment advisor, trader and writer. He has written articles for Technical Analysis of Stocks & Commodities, Traders.com Advantage,Futuresmag.com and, Finance Magnates. Author of website Four Dimension Trading.
PRINT THIS ARTICLE
SEASONAL TRADING
Crude Oil Seasonal Bottoms - Part Two
03/25/21 04:57:19 PMby Mark Rivest
See why the Crude Oil rally could continue into April.
Position: N/A
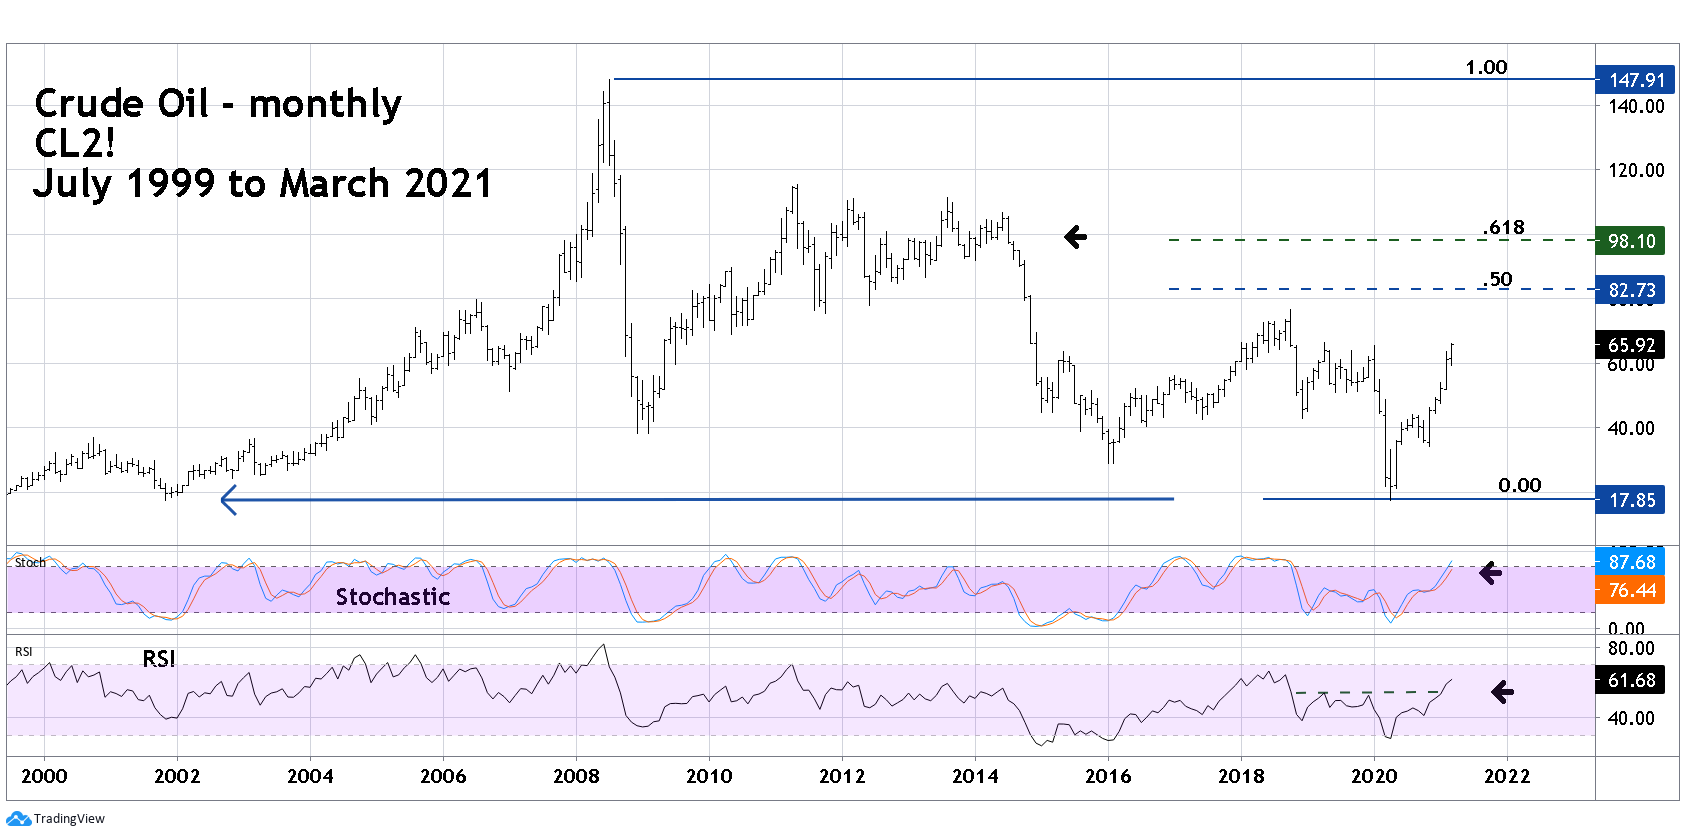
| Since 11/02/20 Crude Oil has been in a strong and steady bull move. In early March 2021 it may appear this market is overbought, but Crude Oil is seasonally bullish until late April. Additionally, long-term, and short-term momentum indicators suggest higher prices. It could be several weeks before oil bulls become exhausted. Long-term View Almost all markets have seasonal tendencies. My 09/23/20 article "Crude Oil Seasonal Bottoms" noted that Crude Oil is seasonally bullish from early December to late April. The article also noted that the Coronavirus knocked Crude Oil off its normal seasonal trajectory and that a seasonal low could come early, possibly October. The bottom came 11/02/20. Please see the monthly chart of Crude Oil Futures (Continuous next contract in front) symbol (CL2!) illustrated in Figure 1. The colossal twelve-year bear market terminated In April 2020 at 17.27 almost at the same price 17.30 made in November 1999. Amazing! Considering the length and depth of the bear market, there's a high probability we are witnessing the kickoff phase a multi-year bull market. The move up from 11/02/20 to 03/05/21 has been an incredible 93%. This could be an overbought condition, however monthly Stochastic has only one line in overbought territory implying room for more upside action. Monthly RSI has moved above the peak it made in April 2019 while price is still below the price peak made in April 2019. This bullish divergence implies higher prices. On 03/05/21 Crude Oil was just below a Fibonacci .382 retrace of the entire bear market. If this level is exceeded, it opens the door for a move up to the 50% retrace area around 82.70. At some point oil could reach the .618 retracement level which also corresponds to significant chart resistance. |
|
| Figure 1. The colossal twelve-year bear market terminated in April 2020 at 17.27, almost at the same price (17.30) made in November 1999. |
| Graphic provided by: TradingView. |
| |
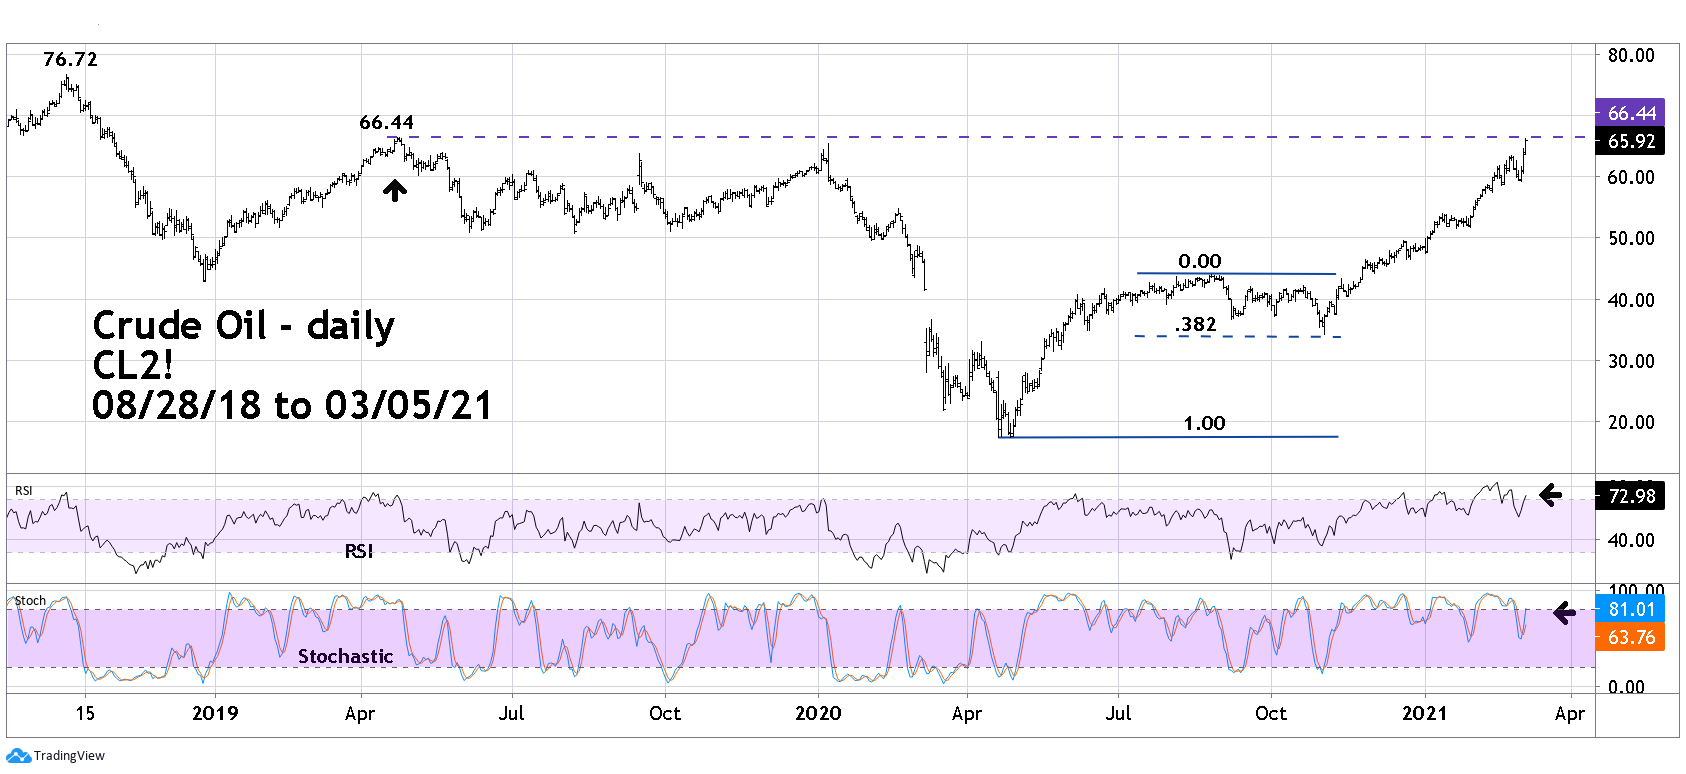
| Short - term View Please see the daily CL2! Chart illustrated in Figure 2. The 11/02/20 bottom came just above the .382 retrace level. My 09/23/20 article speculated a bottom in the range of 27.50 to 31.10. Shallow corrections of bull moves are usually the prelude to powerful upside action, and the rally November to March is a perfect example. The 02/25/21 peak came with a significant daily RSI bearish divergence. Subsequently there was a three-day decline then price rose strongly making a new high. Normally the type of divergence registered on 02/25/21 would trigger a multi-week decline, that it didn't is addition proof of bull market strength. As of 03/05/21 daily RSI now has a double bearish divergence, another top could be forming. However, bears need to be cautious — in an extended uptrend even double bearish divergence can be blown away. The daily Stochastic, like the monthly, has only one line in the overbought zone suggesting in the near-term more upside action. If the April 2019 top at 66.44 is broken it opens the door for a move up the 76.00 area. |
|
| Figure 2. If the April 2019 top at 66.44 is broken it opens the door for a move up the 76.00 area. |
| Graphic provided by: TradingView. |
| |
| Summary After any market's had a big move up it's tempting to go short because prices have gone up so much, how much higher could they go? You need to see what time it is on the market clock. If a markets in the middle of a normally bullish season it could be difficult shorting. If you are short during a bullish time instead of holding short for a month hold for a week. Reduce price targets, if you think maybe a 20% drop perhaps the downside target should be 10%. For bulls in a bullish time the objective is to hold. If when locking in profits you normally sell 25% of the position, perhaps only sell 15 or 10%. As of 03/05/21 Crude Oil has a double bearish divergence. If there's a drop it may only last one or two weeks and fall about 10%. If short, use a decline to exit the position. For bulls watch short-term momentum indicators for an oversold condition. If price drops into an area where a reasonable stop loss order can be placed, it could be an entry point to trade a potential climax move up into April. |
Independent investment advisor, trader and writer. He has written articles for Technical Analysis of Stocks & Commodities, Traders.com Advantage,Futuresmag.com and, Finance Magnates. Author of website Four Dimension Trading.
| Website: | www.fourdimensiontrading.com |
| E-mail address: | markrivest@gmail.com |
Click here for more information about our publications!
PRINT THIS ARTICLE

Request Information From Our Sponsors
- StockCharts.com, Inc.
- Candle Patterns
- Candlestick Charting Explained
- Intermarket Technical Analysis
- John Murphy on Chart Analysis
- John Murphy's Chart Pattern Recognition
- John Murphy's Market Message
- MurphyExplainsMarketAnalysis-Intermarket Analysis
- MurphyExplainsMarketAnalysis-Visual Analysis
- StockCharts.com
- Technical Analysis of the Financial Markets
- The Visual Investor
- VectorVest, Inc.
- Executive Premier Workshop
- One-Day Options Course
- OptionsPro
- Retirement Income Workshop
- Sure-Fire Trading Systems (VectorVest, Inc.)
- Trading as a Business Workshop
- VectorVest 7 EOD
- VectorVest 7 RealTime/IntraDay
- VectorVest AutoTester
- VectorVest Educational Services
- VectorVest OnLine
- VectorVest Options Analyzer
- VectorVest ProGraphics v6.0
- VectorVest ProTrader 7
- VectorVest RealTime Derby Tool
- VectorVest Simulator
- VectorVest Variator
- VectorVest Watchdog