

HOT TOPICS LIST
- MACD
- Fibonacci
- RSI
- Gann
- ADXR
- Stochastics
- Volume
- Triangles
- Futures
- Cycles
- Volatility
- ZIGZAG
- MESA
- Retracement
- Aroon
INDICATORS LIST
LIST OF TOPICS
PRINT THIS ARTICLE
by Matt Blackman
Amazon has, for the most part, been a big mover, but determining where it and the market will go next is the $64 million question.
Position: N/A
Matt Blackman
Matt Blackman is a full-time technical and financial writer and trader. He produces corporate and financial newsletters, and assists clients in getting published in the mainstream media. Matt has earned the Chartered Market Technician (CMT) designation. Follow Matt on Twitter at www.twitter.com/RatioTrade
PRINT THIS ARTICLE
DOUBLE BOTTOMS
Amazon - Still A Big Mover But Which Way?
04/21/22 04:04:55 PMby Matt Blackman
Amazon has, for the most part, been a big mover, but determining where it and the market will go next is the $64 million question.
Position: N/A
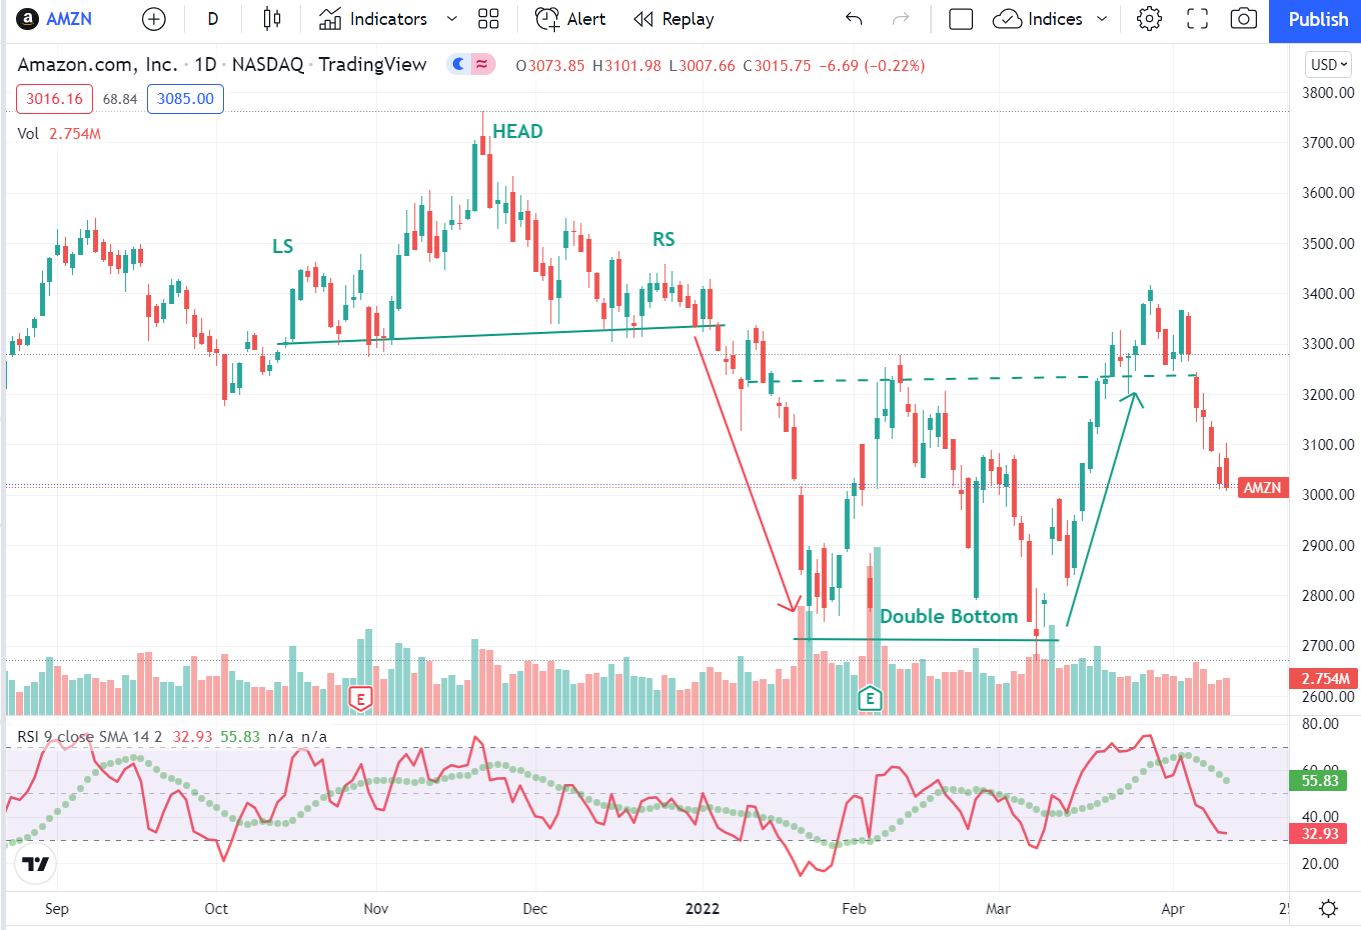
| In the last year online retailer Amazon.com Inc. has more than doubled. And since hitting a new high in late December 2021, it has ranged more than 1,000 points. As we see in Figure 1, AMZN posted a textbook Head & Shoulders pattern from October through December before that pattern played out with a breach of the neckline (green horizontal line) and dropped 700 points to post a medium-term low. This was immediately followed by a bullish Double Bottom pattern that failed to break out decisively. |
|
| Figure 1. Daily chart showing Amazon posting the two latest patterns — one bullish and one bearish. |
| Graphic provided by: TradingView. |
| |
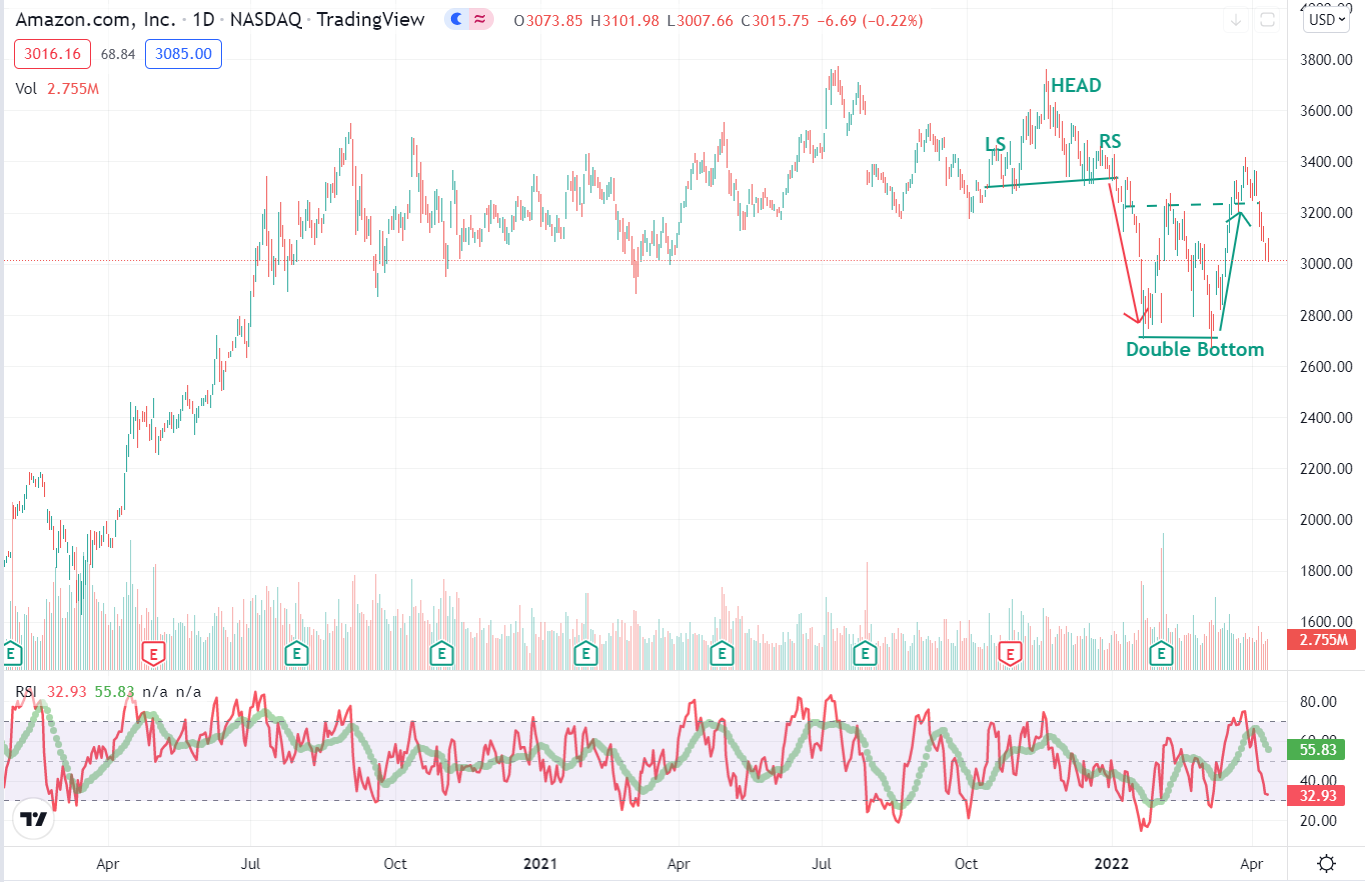
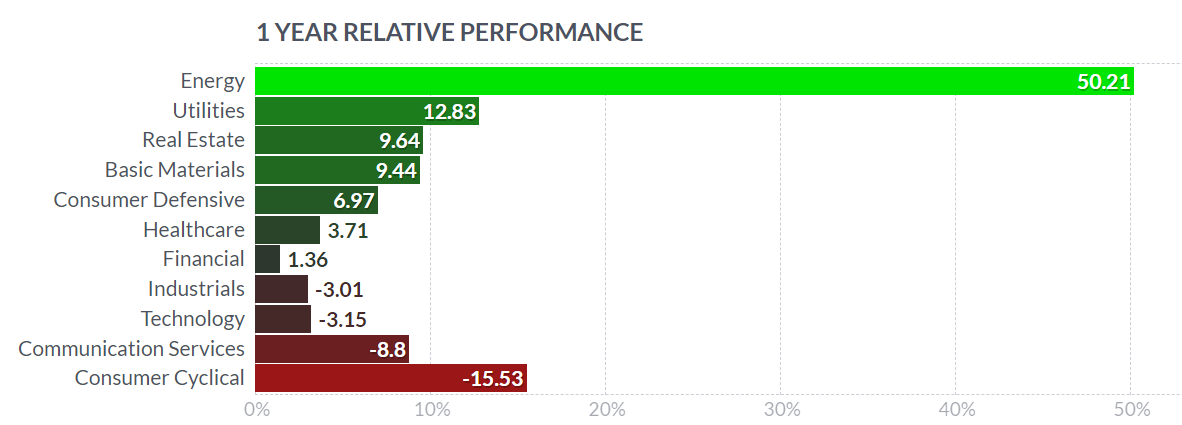
| As we see from a longer-term chart back to March 2020 in Figure 2, AMZN has historically demonstrated trading ranges followed by a big breakouts as we see from April through September 2020 in which the stock price more than doubled. Many might assume that Amazon is a Technology stock but it is actually a Consumer Cyclical stock that just happens to rely heavily on technology to operate. And as we see from Figure 3, both sectors have performed poorly in the last year with Consumer Cyclicals taking last place. |
|
| Figure 2. Longer term chart of Amazon showing the large breakout in late 2020 followed by trading range action. |
| Graphic provided by: TradingView. |
| |
| Fundamentally, with P/E of 47, AMZN looks to be neither cheap nor very expensive when compared to other major retailers. By comparison Walmart is trading around 31 and Costco also at 47 times earnings. |
|
| Figure 3. Sector performance over the last year showing Consumer Cyclical in last place. |
| Graphic provided by: https://finviz.com/. |
| |
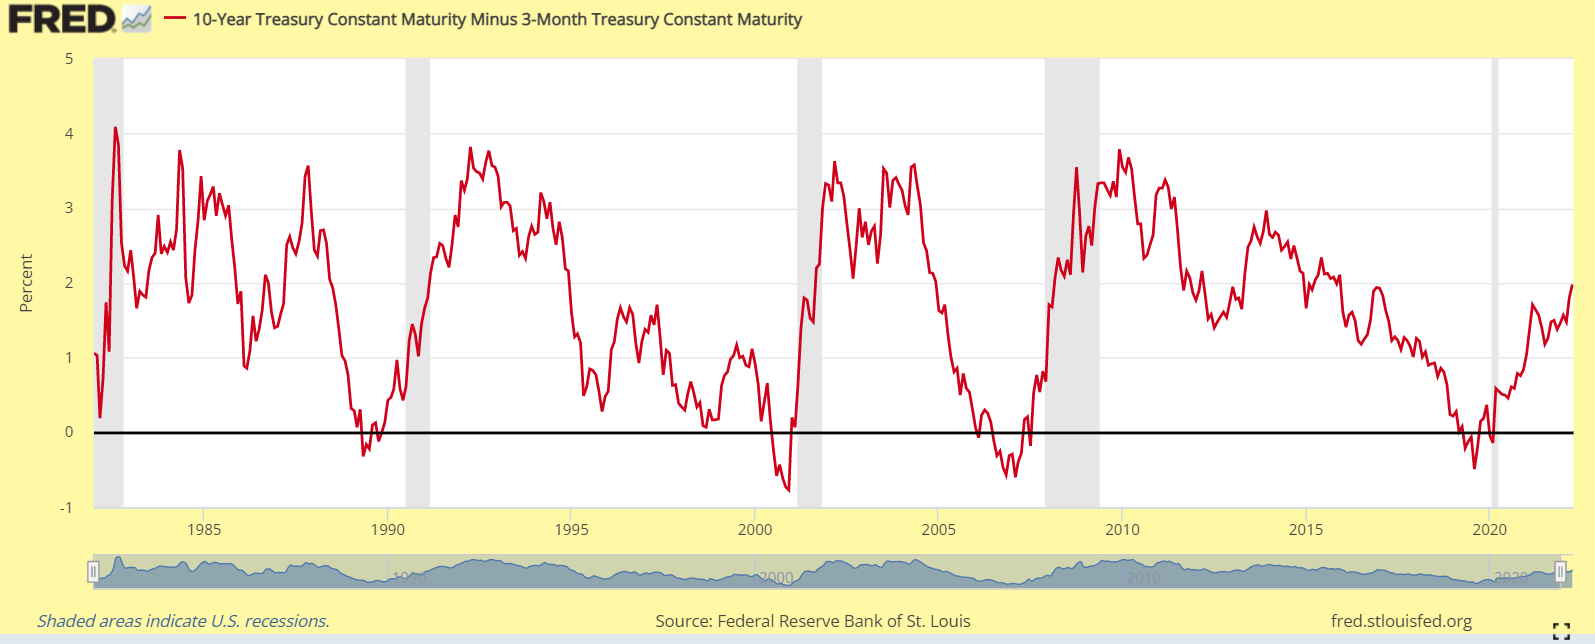
| Positives for the stock is that the company has a habit of beating expectations thanks to innovative management and an aggressive approach to its market and product lineup. But the overall economic lookout remains uncertain and that is something that makes investors nervous. Bonds yields have compressed, especially in the longer-term and the yield curve has already flattened with 30-year dropping below 10-year yields recently. Should this concern us? |
|
| Figure 4. Updated chart showing 10-Year minus 3-month Treasury yields from January 1982 to April 2022. Gray bands indicate past recessions. |
| Graphic provided by: https://fred.stlouisfed.org/. |
| |
| As Professor Campbell Harvey demonstrated in the 1980s, when the 10-Year US Treasury yield drops below the 3-month yield and stays negative for at least one quarter, a recession has followed 100% of the time since 1962. Thirty years later that record remains unblemished. Granted 10-year and 3-month yields still have a healthy gap separating them but this relationship can change quickly in a weakening economic so bears watching. Suggested Reading: Buffett Indicator Takes a Pause - Should we be concerned? Code REC - False Alarm Or Early Warning? The Treasury Yield Curve Inverted Again - Should We Be Worried? |
Matt Blackman is a full-time technical and financial writer and trader. He produces corporate and financial newsletters, and assists clients in getting published in the mainstream media. Matt has earned the Chartered Market Technician (CMT) designation. Follow Matt on Twitter at www.twitter.com/RatioTrade
| Title: | Author |
| Company: | TradeSystemGuru |
| Address: | Box 2589 |
| Garibaldi Highlands, BC V0N1T0 | |
| Phone # for sales: | 6048989069 |
| E-mail address: | indextradermb@gmail.com |
Traders' Resource Links | |
| TradeSystemGuru has not added any product or service information to TRADERS' RESOURCE. | |
Click here for more information about our publications!
Comments

Request Information From Our Sponsors
- StockCharts.com, Inc.
- Candle Patterns
- Candlestick Charting Explained
- Intermarket Technical Analysis
- John Murphy on Chart Analysis
- John Murphy's Chart Pattern Recognition
- John Murphy's Market Message
- MurphyExplainsMarketAnalysis-Intermarket Analysis
- MurphyExplainsMarketAnalysis-Visual Analysis
- StockCharts.com
- Technical Analysis of the Financial Markets
- The Visual Investor
- VectorVest, Inc.
- Executive Premier Workshop
- One-Day Options Course
- OptionsPro
- Retirement Income Workshop
- Sure-Fire Trading Systems (VectorVest, Inc.)
- Trading as a Business Workshop
- VectorVest 7 EOD
- VectorVest 7 RealTime/IntraDay
- VectorVest AutoTester
- VectorVest Educational Services
- VectorVest OnLine
- VectorVest Options Analyzer
- VectorVest ProGraphics v6.0
- VectorVest ProTrader 7
- VectorVest RealTime Derby Tool
- VectorVest Simulator
- VectorVest Variator
- VectorVest Watchdog