HOT TOPICS LIST
- MACD
- Fibonacci
- RSI
- Gann
- ADXR
- Stochastics
- Volume
- Triangles
- Futures
- Cycles
- Volatility
- ZIGZAG
- MESA
- Retracement
- Aroon
INDICATORS LIST
LIST OF TOPICS
PRINT THIS ARTICLE
by Matt Blackman
Careful analysis is one essential component of making successful trades. Admitting you were wrong is another.
Position: N/A
Matt Blackman
Matt Blackman is a full-time technical and financial writer and trader. He produces corporate and financial newsletters, and assists clients in getting published in the mainstream media. Matt has earned the Chartered Market Technician (CMT) designation. Follow Matt on Twitter at www.twitter.com/RatioTrade
PRINT THIS ARTICLE
Timing The Trade - Knowing When To Switch Horses
11/24/21 12:50:37 PMby Matt Blackman
Careful analysis is one essential component of making successful trades. Admitting you were wrong is another.
Position: N/A
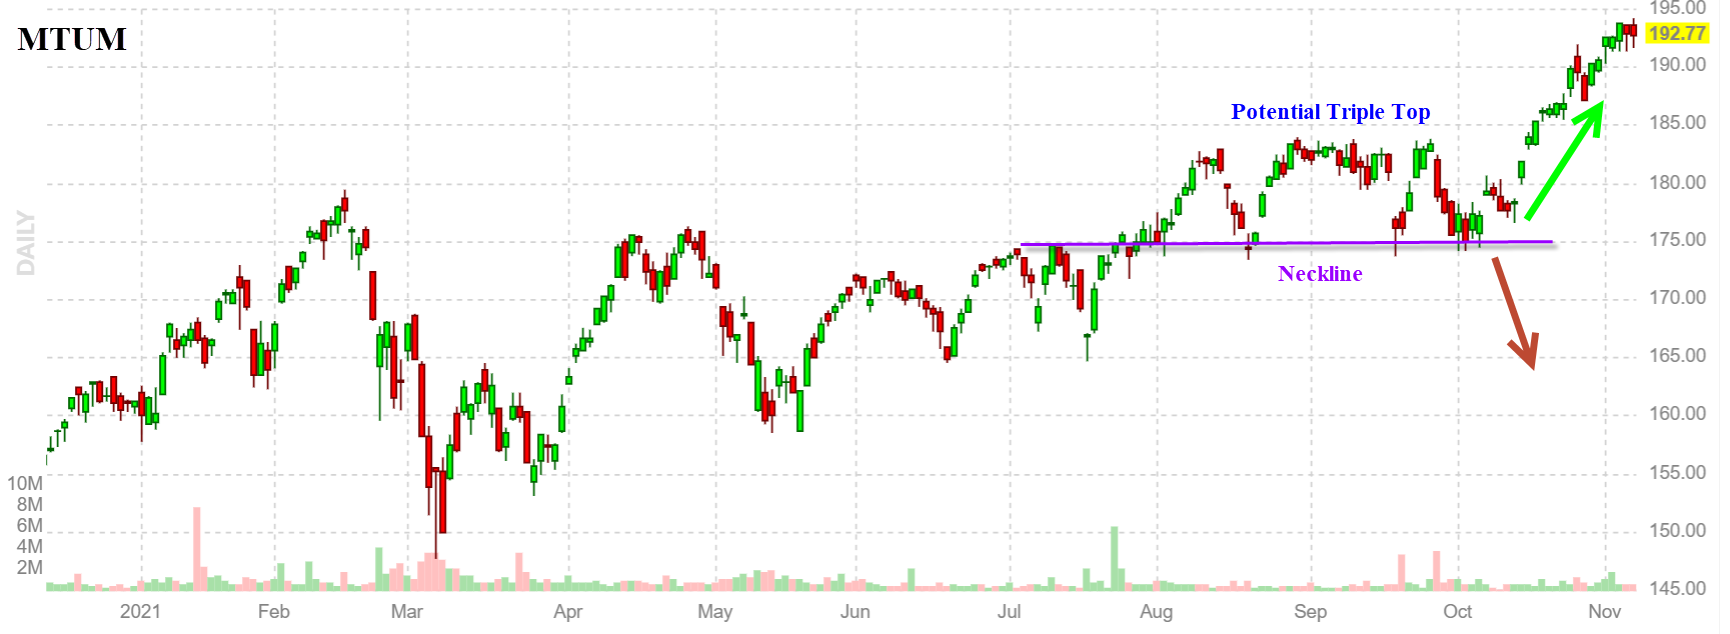
| In a recent article, I discussed a number of bearish chart patterns that were warning of a potential top not only in these stocks but also in the overall market. As any expert will tell you, the key to making a successful trade requires performing your analysis, choosing your highest probability entry points, identifying trade confirmations and once in the trade choosing exit points. If successful and the trade is confirmed, trade management takes over and a profit target is confirmed. If not successful and the stop loss point is hit, the trade is promptly exited. But what if the trade entry point is violated? Is all the homework you've done now wasted? Not necessarily! As we see in the following charts, the sell set ups look textbook perfect, until they don't. In Figure 1, iShares MSCI USA Momentum Factor ETF (MTUM) posts a very nice bearish Triple Top chart pattern with a potential sell entry just below the neckline (purple) to be taken on above average selling volume followed by confirmation in the way of an upside test of the neckline on any rallies. But that didn't happen. After touching the neckline four times, MTUM gapped higher, never a good sign on a potential sell trade. This is followed by a five day bull flag pattern and two more upside gaps and finally a strong rally to new highs. |

|
| Figure 1 – Daily iShares MSCI USA Momentum Factor ETF (MTUM) showing pattern invalidation. |
| Graphic provided by: https://finviz.com/. |
| |
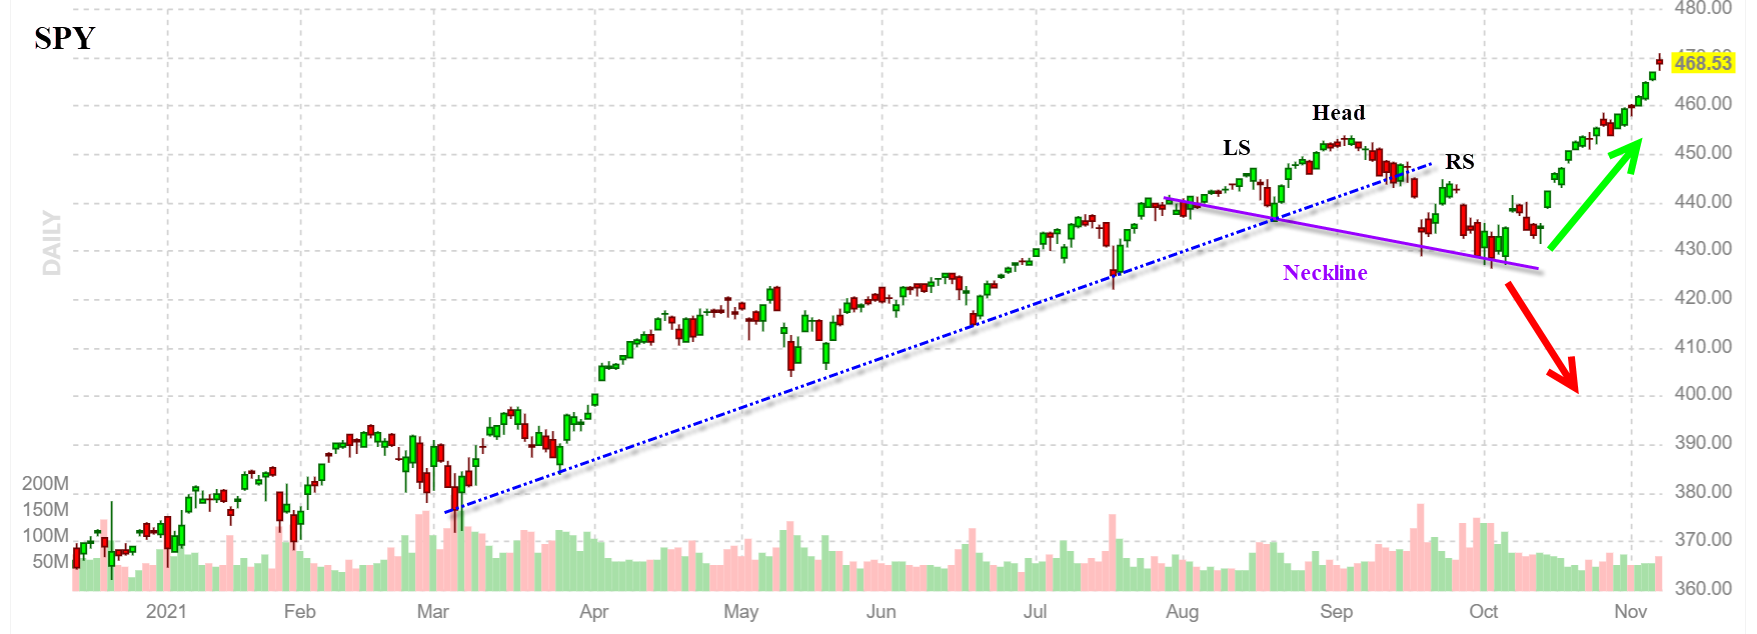
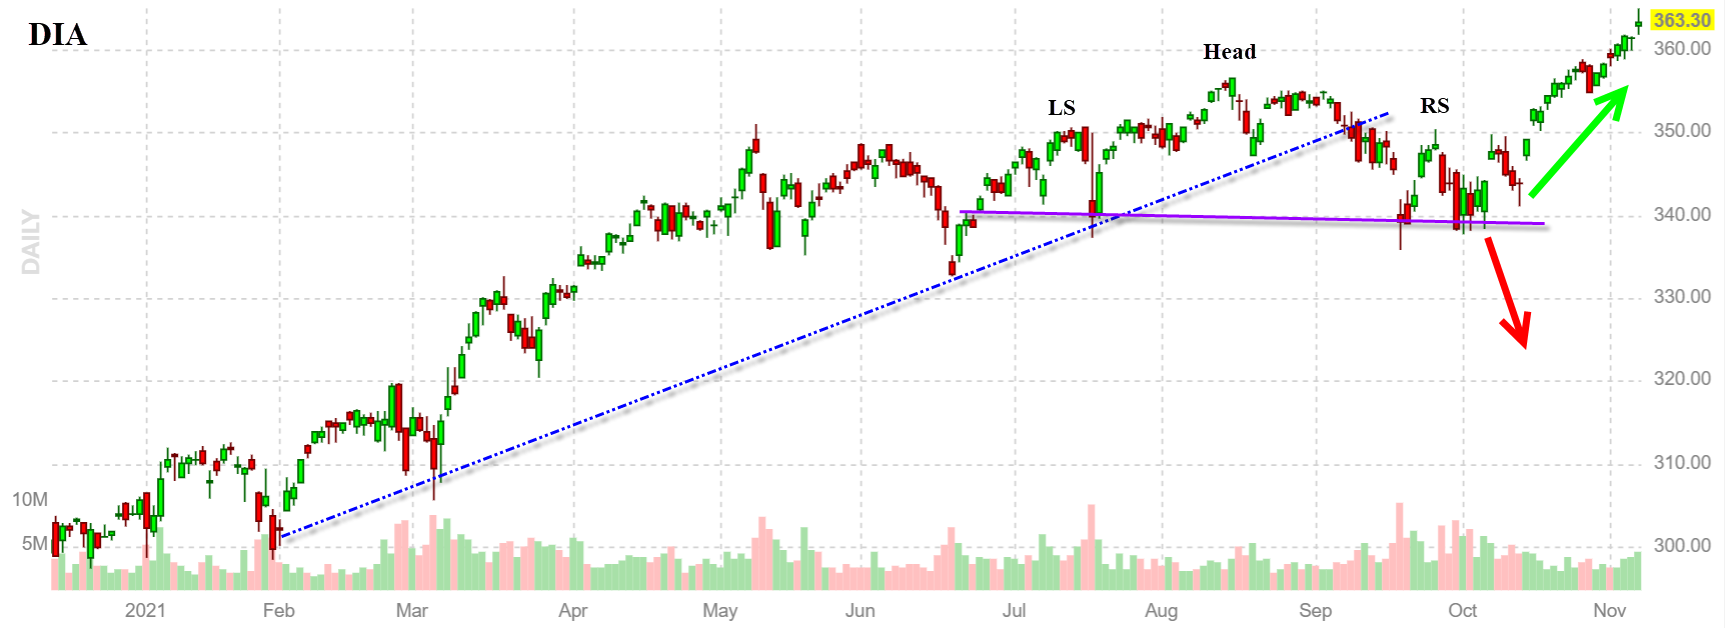
| We see a similar situation occur with both the SPDR S&P 500 ETF Trust (SPY) and SPDR Dow Jones Industrial Average ETF Trust (DIA) below except that instead of a Triple Top, the patterns are bearish Head & Shoulders patterns and both are as decisively invalidated as the Triple Top. |

|
| Figure 2 – Daily the SPDR S&P 500 ETF Trust (SPY) and bullish reversal. |
| Graphic provided by: https://finviz.com/. |
| |
| The lessons are threefold. First, no matter how perfect a trade setup looks, it is never a good idea to jump the gun and enter early. Secondly, if the chart suddenly gets frisky in the opposite direction, it's probably wise to consider a counter-direction trade, and in all three cases on rising buying volume and bullish chart pattern occurrence. Finally, this demonstrates why it is so important to never 'marry' a trade or market opinion. |

|
| Figure 3 – Daily and SPDR Dow Jones Industrial Average ETF Trust (DIA) chart and bull reversal. |
| Graphic provided by: https://finviz.com/. |
| |
| These examples also demonstrate the importance to playing devil's advocate as part of your trade analysis. It is easy to get caught up in a sentiment trap in which your head is screaming at you to do something and everything you see seems to be confirming that decision. Like the inexperienced visual flight rules (VFR) pilot stuck in cloud whose instruments are telling him that he's spiralling out of control but instead relies on gut feel, marrying a trade based on gut or preconceived assumptions can be deadly, at least from an account perspective! |
| Suggested Reading: It's Topping Season - But Is the Worst Over? |
Matt Blackman is a full-time technical and financial writer and trader. He produces corporate and financial newsletters, and assists clients in getting published in the mainstream media. Matt has earned the Chartered Market Technician (CMT) designation. Follow Matt on Twitter at www.twitter.com/RatioTrade
| Title: | Author |
| Company: | TradeSystemGuru |
| Address: | Box 2589 |
| Garibaldi Highlands, BC V0N1T0 | |
| Phone # for sales: | 6048989069 |
| E-mail address: | indextradermb@gmail.com |
Traders' Resource Links | |
| TradeSystemGuru has not added any product or service information to TRADERS' RESOURCE. | |
Click here for more information about our publications!
Comments
Date: 12/08/21Rank: 4Comment:

Request Information From Our Sponsors
- StockCharts.com, Inc.
- Candle Patterns
- Candlestick Charting Explained
- Intermarket Technical Analysis
- John Murphy on Chart Analysis
- John Murphy's Chart Pattern Recognition
- John Murphy's Market Message
- MurphyExplainsMarketAnalysis-Intermarket Analysis
- MurphyExplainsMarketAnalysis-Visual Analysis
- StockCharts.com
- Technical Analysis of the Financial Markets
- The Visual Investor
- VectorVest, Inc.
- Executive Premier Workshop
- One-Day Options Course
- OptionsPro
- Retirement Income Workshop
- Sure-Fire Trading Systems (VectorVest, Inc.)
- Trading as a Business Workshop
- VectorVest 7 EOD
- VectorVest 7 RealTime/IntraDay
- VectorVest AutoTester
- VectorVest Educational Services
- VectorVest OnLine
- VectorVest Options Analyzer
- VectorVest ProGraphics v6.0
- VectorVest ProTrader 7
- VectorVest RealTime Derby Tool
- VectorVest Simulator
- VectorVest Variator
- VectorVest Watchdog
