HOT TOPICS LIST
- MACD
- Fibonacci
- RSI
- Gann
- ADXR
- Stochastics
- Volume
- Triangles
- Futures
- Cycles
- Volatility
- ZIGZAG
- MESA
- Retracement
- Aroon
INDICATORS LIST
LIST OF TOPICS
PRINT THIS ARTICLE
by Matt Blackman
As another Halloween approaches and with it a rising number of bearish market forecasts, is now the time to hunker down with your portfolios?
Position: N/A
Matt Blackman
Matt Blackman is a full-time technical and financial writer and trader. He produces corporate and financial newsletters, and assists clients in getting published in the mainstream media. Matt has earned the Chartered Market Technician (CMT) designation. Follow Matt on Twitter at www.twitter.com/RatioTrade
PRINT THIS ARTICLE
CHART ANALYSIS
It's Topping Season - But Is the Worst Over?
11/01/21 04:38:32 PMby Matt Blackman
As another Halloween approaches and with it a rising number of bearish market forecasts, is now the time to hunker down with your portfolios?
Position: N/A
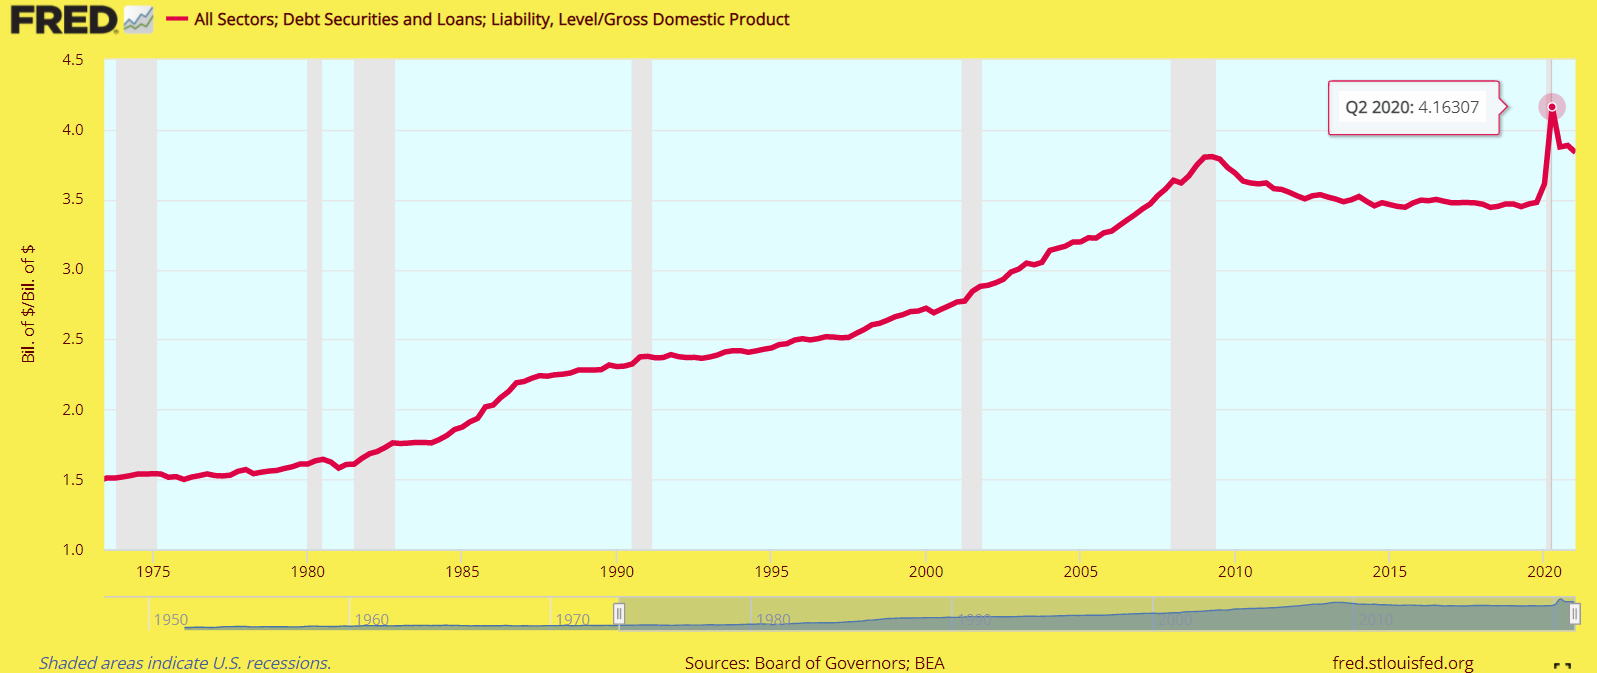
| September lived up to its reputation as the worst month of the year for stocks. In an average September over the last 92 years, the S&P500 Index has dropped an average of one percent. In September 2021 the index lost 4.8% with the SPDR S&P500 ETF Trust (SPY) falling 5.2% and the SPDR Dow Jones Industrial Average ETF Trust (DIA) dropping 4.5%. Over the last 92 years, Octobers have gained 0.4% on average but that hasn't stopped the flow of bearish forecasts going forward. So is the worst over or is this the start of a more protracted correction with the possibility of a bear market? Notably Robert Kiyosaki, author of Rich Dad Poor Dad, is calling for "the biggest crash in world history" claiming that "we have never had this much debt pumped up... the debt to GDP ratio is out of sight," (see article). |

|
| Figure 1. Total Credit Market Debt/GDP showing the ratio at 4.16 in Q2-2021. The second highest ratio occurred in Q2-2009 at 3.8. |
| Graphic provided by: https://fred.stlouisfed.org/. |
| |
| But will this be enough to trigger a crash - now? As we have seen with Warren Buffett's "favorite market valuation indicator", calling a top has been challenging (see Buffett's Indicator) to say the least. For example, his indicator hit an extreme high in 2000 before the 2001-2003 bear market but was still well off this previous high going into the 2008-9 bear market. True it is at a new all-time now and has been consistently making new highs for more than a year now according to Federal Reserve data. So is it time to get defensive? For insight, let's take a look some charts. |

|
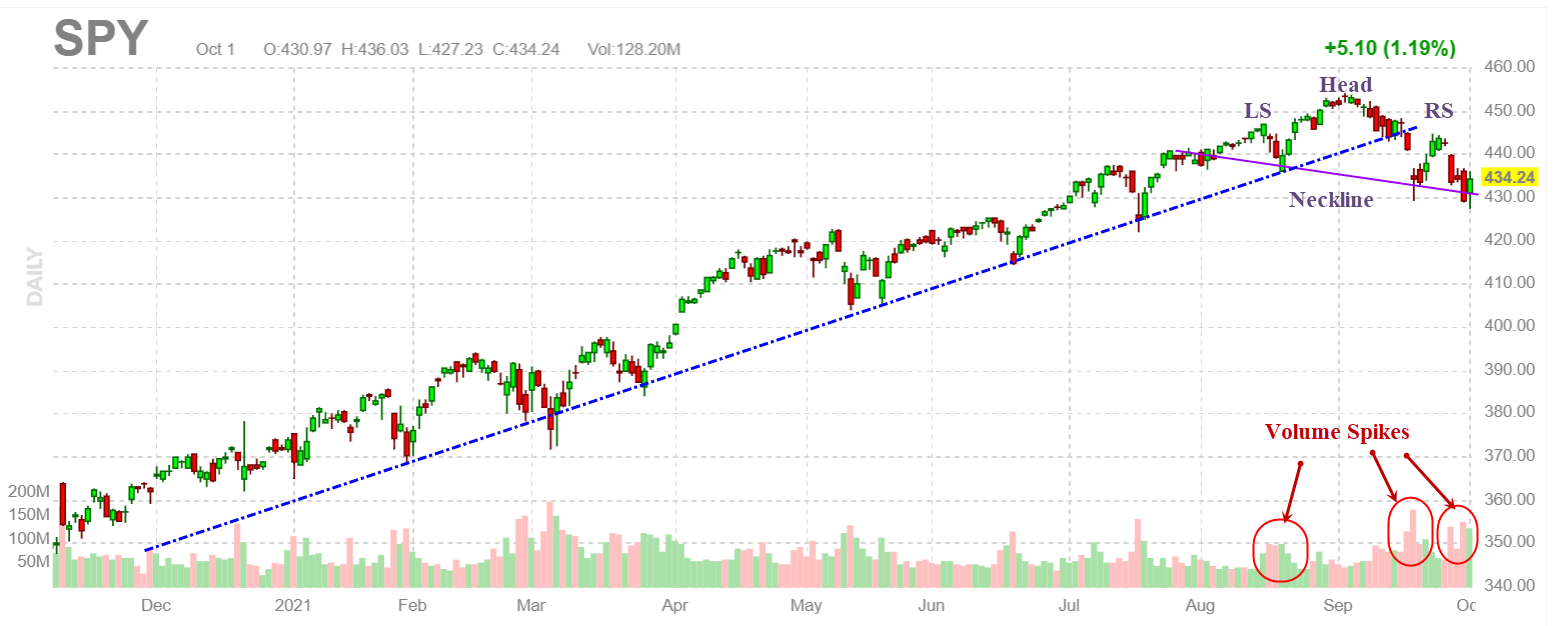
| Figure 2. Daily chart of the SPDR S&P500 ETF Trust (SPY) showing the potential bearish Head & Shoulders pattern with supporting volume spikes and downward sloping neckline. |
| Graphic provided by: https://finviz.com/. |
| |
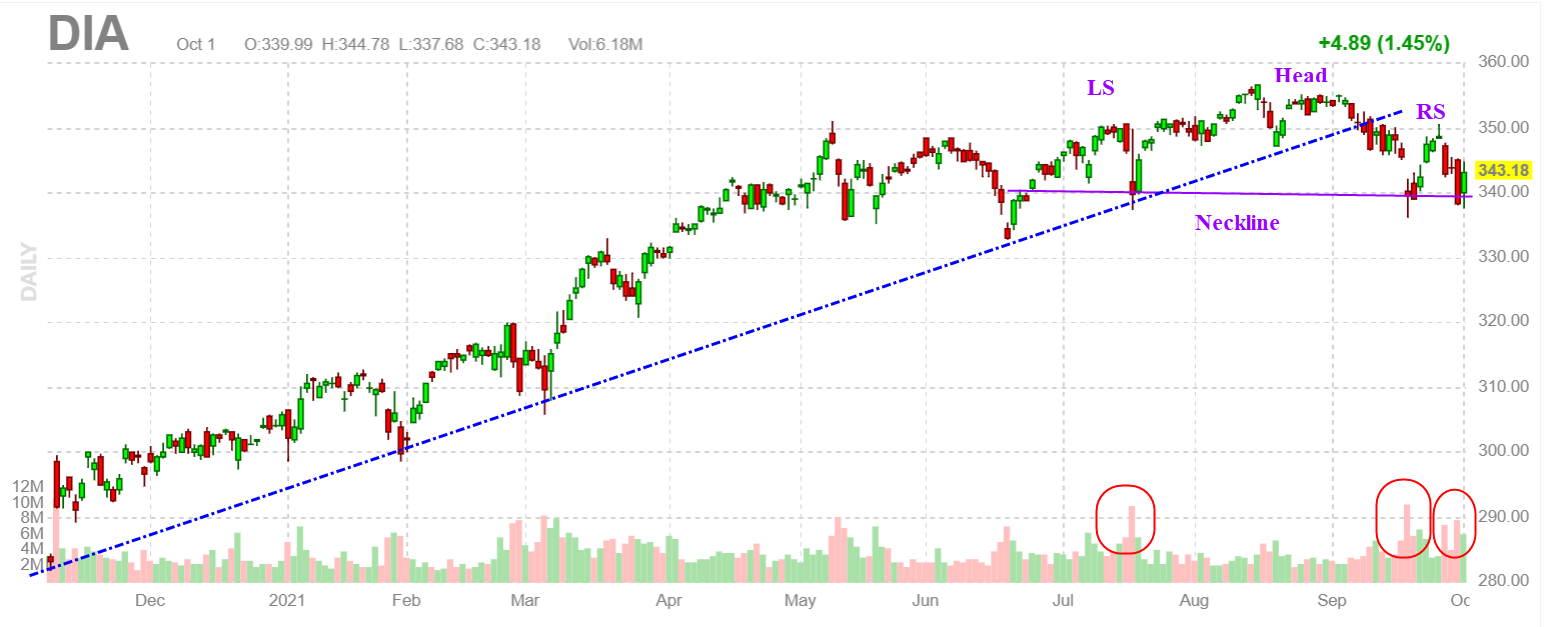
| First up is the S&P500 ETF (SPY) in Figure 2. As a stock, unlike the index, we have the benefit of seeing volumes. We see that after enjoying a strong up trend, SPY hit some turbulence in September, breaking long-term uptrend support (blue dashed line) before putting it a potential Head & Shoulders pattern with downward sloping neckline. The pattern would be confirmed with a decisive breach of this neckline on above average selling volume. Next, let's look at the Dow Jones Industrial Average ETF (DIA). Here we see a similar story with uptrend support (dashed blue line) being broken in early September with the subsequent formation of the right shoulder of a potential Head & Shoulders pattern with horizontal neckline around 340 and similar volume pattern to the SPY. |

|
| Figure 3. Daily SPDR Dow Jones Industrial Average ETF Trust (DIA) showing an equally bearish Head & Shoulders pattern, volume and neckline. |
| Graphic provided by: https://finviz.com/. |
| |
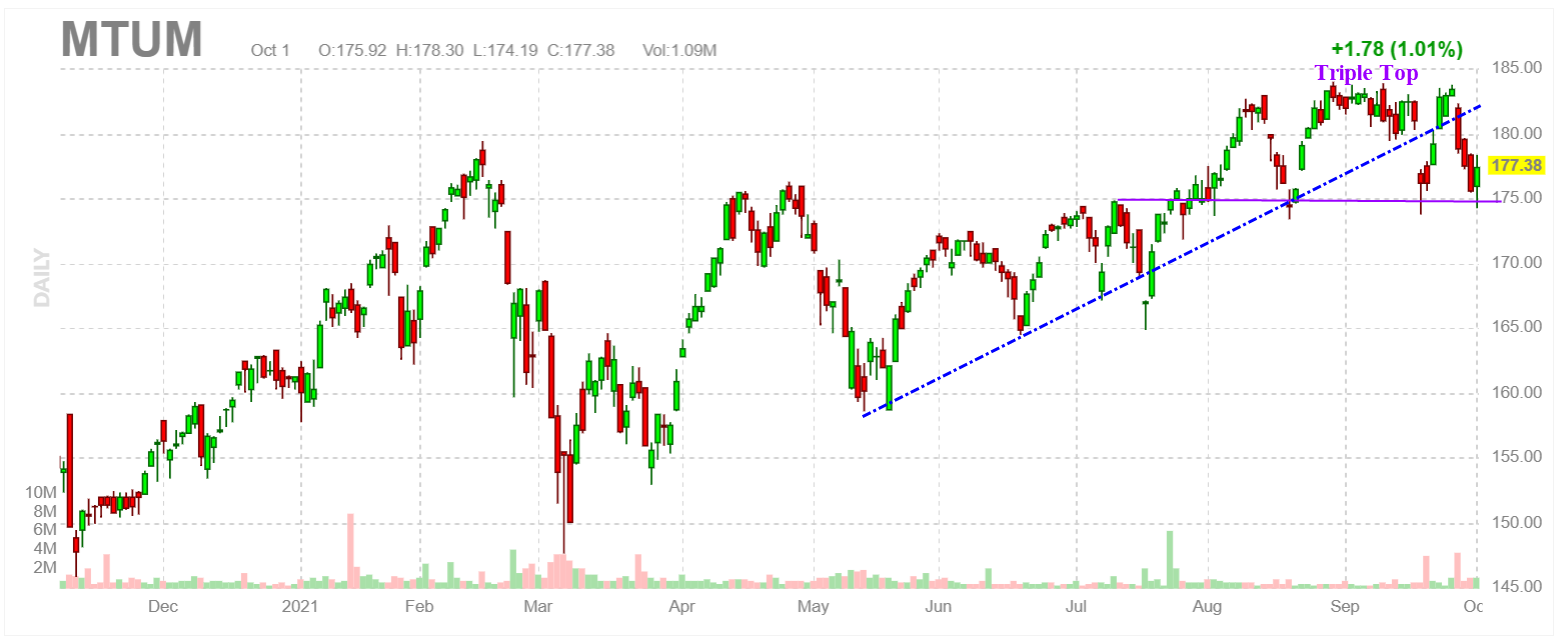
| In our next chart, we see the iShares MSCI USA Momentum Factor ETF showing a breach of uptrend support and the formation of a bearish potential Triple Top chart pattern. This ETF consists of a portfolio of 129 stocks "exhibiting relatively higher momentum characteristics from the traditional market capitalization-weighted parent index." Tesla (TSLA), JP Morgan Chase (JPM), Disney (DES), Bershire Hathaway (BRK/B) and Bank of America (BAC) make up its top five holdings. Slowing in these juggernaut market risers would be bearish indeed, especially if the bearish Triple Top pattern in Figure 4 is confirmed with a decisive breach of the neckline on rising selling volume. |

|
| Figure 4. Daily chart of the iShares MSCI USA Momentum Factor ETF (MTUM) showing a breach of the medium-term uptrend support (dashed blue line) and formation of a potential Triple Top pattern. |
| Graphic provided by: https://finviz.com/. |
| |
| The trouble with single indicators like total debt/GDP or Buffett's Valuation index is that they only represent one small part of a massive and complex market. Robert Kiyosaki's "biggest crash in history" call is just that: a single indicator based on linear assumptions that we have printed too much money and accumulated too much debt. Both have been rising since the beginning of our modern era. And as any first year economics student knows, debt only becomes a critical problem when people can no longer service that debt, a situation generally triggered by rapidly rising interest rates ̶ and 10-Year Treasuries hovering around 1.5 percent hardly qualify as onerous. If we see the bearish patterns outlined above confirmed, it will be time to get more defensive, if these patterns haven't yet caused this move. And if all hell breaks loose and the wheels truly come of this market bus in the worst crash in history, we will all be be facing problems far more serious than a decimated stock portfolio! Suggested Reading: Is the Stock Market's October Effect Real? 'Biggest crash in world history': Personal finance expert Robert Kiyosaki predicts economic crisis in October Costco - Steady Eddy Consumer Defense Stock Market Cycle Trifecta - What Are The Three Asset Classes Telling Us? Buffett's Indicator Portfolio Composition: MTUM |
Matt Blackman is a full-time technical and financial writer and trader. He produces corporate and financial newsletters, and assists clients in getting published in the mainstream media. Matt has earned the Chartered Market Technician (CMT) designation. Follow Matt on Twitter at www.twitter.com/RatioTrade
| Title: | Author |
| Company: | TradeSystemGuru |
| Address: | Box 2589 |
| Garibaldi Highlands, BC V0N1T0 | |
| Phone # for sales: | 6048989069 |
| E-mail address: | indextradermb@gmail.com |
Traders' Resource Links | |
| TradeSystemGuru has not added any product or service information to TRADERS' RESOURCE. | |
Click here for more information about our publications!
PRINT THIS ARTICLE

Request Information From Our Sponsors
- StockCharts.com, Inc.
- Candle Patterns
- Candlestick Charting Explained
- Intermarket Technical Analysis
- John Murphy on Chart Analysis
- John Murphy's Chart Pattern Recognition
- John Murphy's Market Message
- MurphyExplainsMarketAnalysis-Intermarket Analysis
- MurphyExplainsMarketAnalysis-Visual Analysis
- StockCharts.com
- Technical Analysis of the Financial Markets
- The Visual Investor
- VectorVest, Inc.
- Executive Premier Workshop
- One-Day Options Course
- OptionsPro
- Retirement Income Workshop
- Sure-Fire Trading Systems (VectorVest, Inc.)
- Trading as a Business Workshop
- VectorVest 7 EOD
- VectorVest 7 RealTime/IntraDay
- VectorVest AutoTester
- VectorVest Educational Services
- VectorVest OnLine
- VectorVest Options Analyzer
- VectorVest ProGraphics v6.0
- VectorVest ProTrader 7
- VectorVest RealTime Derby Tool
- VectorVest Simulator
- VectorVest Variator
- VectorVest Watchdog
