HOT TOPICS LIST
- MACD
- Fibonacci
- RSI
- Gann
- ADXR
- Stochastics
- Volume
- Triangles
- Futures
- Cycles
- Volatility
- ZIGZAG
- MESA
- Retracement
- Aroon
INDICATORS LIST
LIST OF TOPICS
PRINT THIS ARTICLE
by Mark Rivest
Time cycles and momentum indicate a major top could be forming.
Position: N/A
Mark Rivest
Independent investment advisor, trader and writer. He has written articles for Technical Analysis of Stocks & Commodities, Traders.com Advantage,Futuresmag.com and, Finance Magnates. Author of website Four Dimension Trading.
PRINT THIS ARTICLE
FIBONACCI
US Stock Bull Market Could End in December 2021
11/24/21 12:45:15 PMby Mark Rivest
Time cycles and momentum indicate a major top could be forming.
Position: N/A
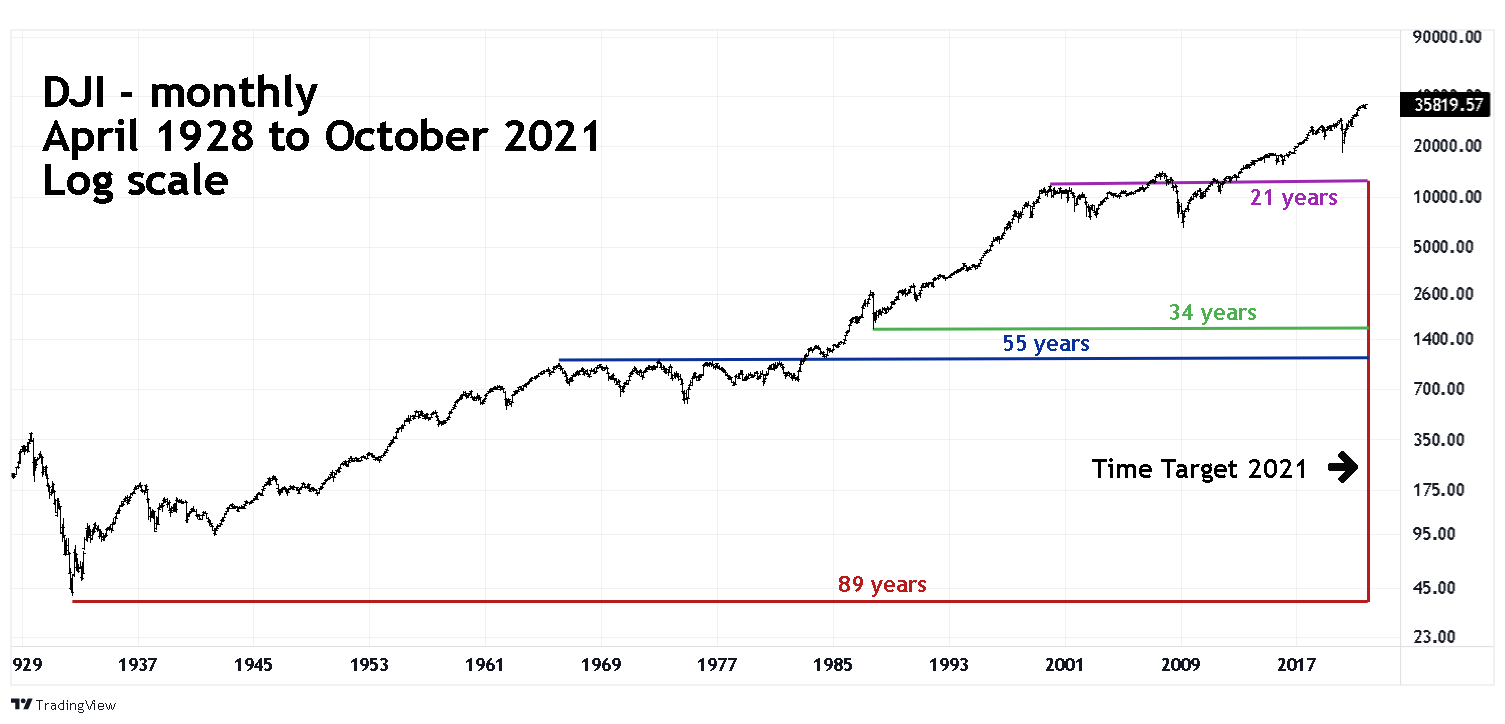
| From March 2020 to October 2021 the US stock market as measured by the S&P 500 (SPX) has risen a spectacular 110%. Outside of the Nasdaq Composite technology stock mania from October 1998 to March 2000 there has not been a move up this far and fast since the Dow Jones Industrial Average (DJI) bull market in the mid 1930's. Long-term time cycles and deteriorating bullish momentum suggest the bull run could terminate in December 2021. Long-term Time Cycles My January 9, 2020 article "Forecast for US Stocks in 2020" illustrated a fascinating web of Fibonacci time cycles dating back to the major DJI bottom made in 1932. Please see the update of this Monthly DJI chart illustrated in Figure 1. Occasionally markets have movements that can be measured by the numbers within the Fibonacci sequence, a partial listing is (1, 1, 2, 3, 5, 8, 13, 21, 34, 55, 89, 144, ---- to infinity.) Several of the DJI major turning points over the last eighty-nine years point to 2021 as another potential turning point. This methodology does not predict tops or bottoms only potential turning points. Market action going into the time target determines tops/bottoms. The DJI rallied into 2021 and implies a significant peak. The coordinates for this forecast are yearly and only point to a turn sometime in 2021 — a wide range. To determine greater precision, we need to examine the next lower time scale, in this case monthly. |

|
| Figure 1. The DJI rallied into 2021 and implies a significant peak. |
| Graphic provided by: TradingView. |
| |
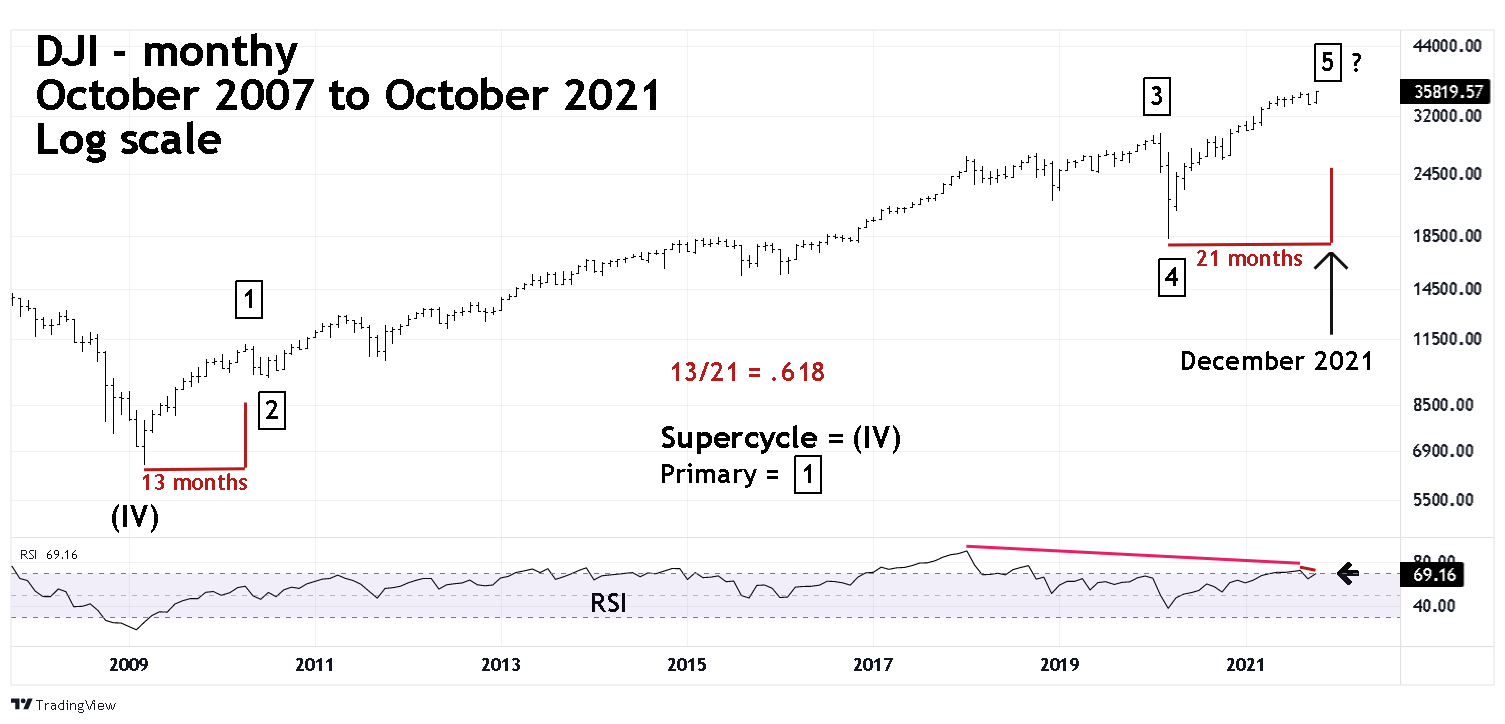
| Time Cycles 2009 To 2021 Please see the monthly 2007 to 2021 DJI chart illustrated in Figure 2. The DJI from the major bottom made in March 2009 appears to be forming an Elliott five-wave impulse pattern. The DJI March 2009 to April 2010 rally, the presumed Primary wave "1"-boxed was 13 months — a Fibonacci sequence number. There's usually a Fibonacci time and or price relationship between the first and fifth sub waves of Elliott five-wave impulse patterns. If the rally from March 2020, the presumed Primary wave "5", continues into December 2021 it will be 21 months — another Fibonacci sequence number. This creates a Fibonacci relationship between Primary waves "1" and "5" of 13/21 = .618 — the Golden Ratio. Note that the Monthly RSI as of the end of October 2021 had a double bearish divergence. There's also evidence on the daily time scale indicating deteriorating bullish momentum. |

|
| Figure 2. There is usually a Fibonacci time and or price relationship between the first and fifth sub waves of Elliott five-wave impulse patterns. |
| Graphic provided by: TradingView. |
| |
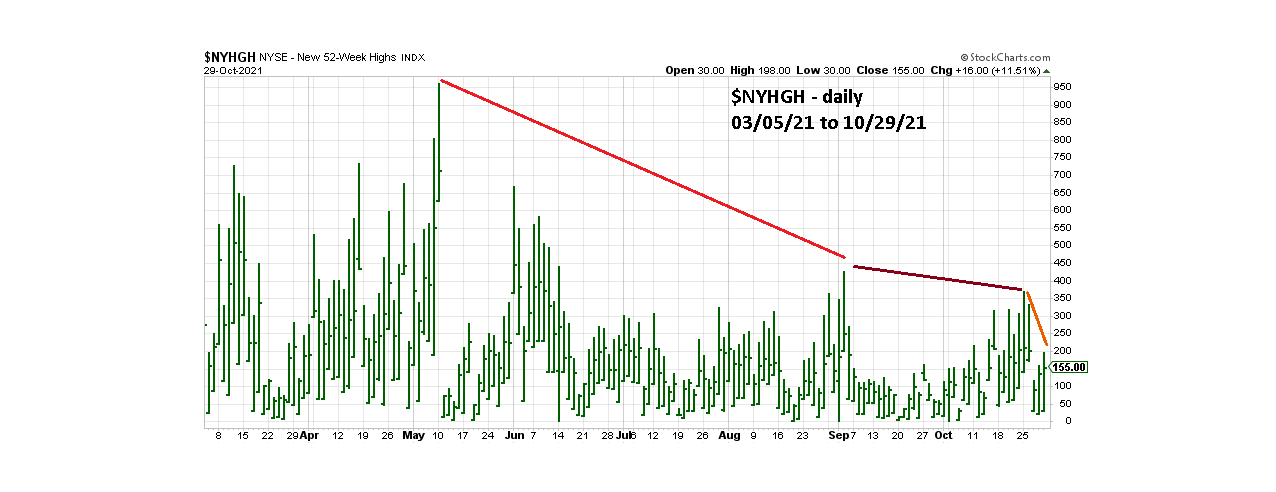
| NYSE New 52-Week Highs Please see the daily NYSE new 52-week highs ($NYHGH) chart illustrated in Figure 3. The SPX 09/02/21 all-time high had a significant bearish divergence vs. the reading in May 2021. On the recent rally the divergence continued with the SPX making a new all-time high on 10/25/21. The reading on 10/29/21 with the SPX making another all-time high, new highs continued to deteriorate. |

|
| Figure 3. The reading on 10/29/21 with the SPX making another all-time high new highs continued to deteriorate. |
| Graphic provided by: StockCharts.com. |
| |
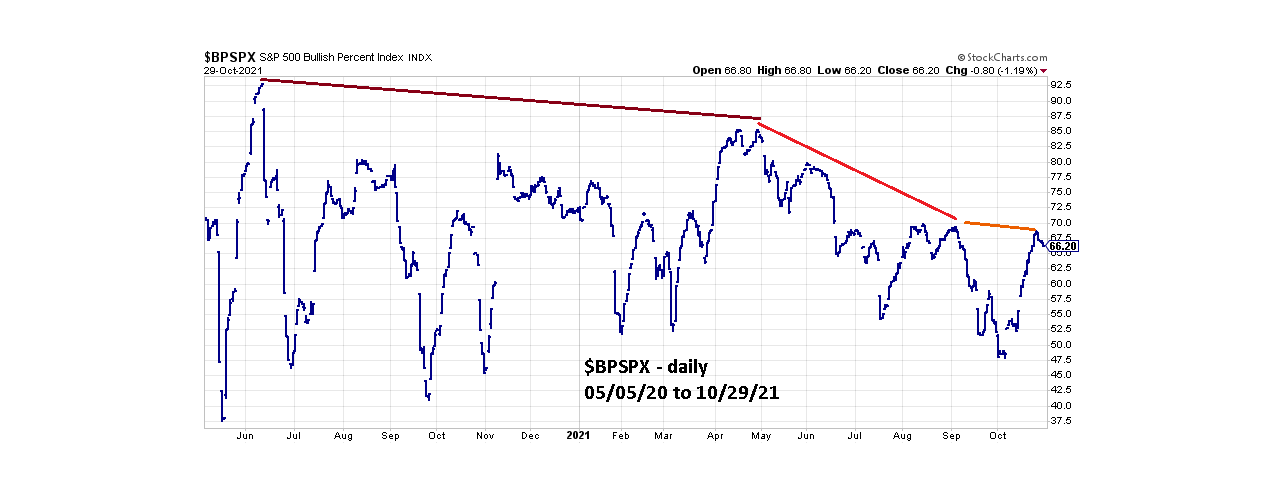
| Please see the daily S&P 500 Bullish Percent Index ($BPSPX) chart illustrated in Figure 4. The Bullish Percent Index, is a breadth indicator that shows the percentage of stocks on Point & Figure buy signals; in this case the stocks within the SPX. Not only is there a significant long-term bearish divergence, but there are also fascinating short-term bearish divergences. Note that at the 09/02/21 all-time high $BPSPX had a short-term bearish divergence vs. the August 2021 high. The reading on 10/26/21 diverged on the 09/02/21 reading and on 10/28/21 and 10/29/21 $BPSPX went down while the SPX went up. |

|
| Figure 4. On 10/28/21 and 10/29/21 $BPSPX went down while the SPX went up. |
| Graphic provided by: StockCharts.com. |
| |
| Summary November is seasonally the most bullish month for US stocks, meaning the major stock indices finish the month higher than it opened. If stocks decline in early November the drop could be brief. If US stocks rally from mid-November into December 2021 with deteriorating bullish momentum it could be the cusp of a major bear trend. |
Independent investment advisor, trader and writer. He has written articles for Technical Analysis of Stocks & Commodities, Traders.com Advantage,Futuresmag.com and, Finance Magnates. Author of website Four Dimension Trading.
| Website: | www.fourdimensiontrading.com |
| E-mail address: | markrivest@gmail.com |
Click here for more information about our publications!
Comments

Request Information From Our Sponsors
- StockCharts.com, Inc.
- Candle Patterns
- Candlestick Charting Explained
- Intermarket Technical Analysis
- John Murphy on Chart Analysis
- John Murphy's Chart Pattern Recognition
- John Murphy's Market Message
- MurphyExplainsMarketAnalysis-Intermarket Analysis
- MurphyExplainsMarketAnalysis-Visual Analysis
- StockCharts.com
- Technical Analysis of the Financial Markets
- The Visual Investor
- VectorVest, Inc.
- Executive Premier Workshop
- One-Day Options Course
- OptionsPro
- Retirement Income Workshop
- Sure-Fire Trading Systems (VectorVest, Inc.)
- Trading as a Business Workshop
- VectorVest 7 EOD
- VectorVest 7 RealTime/IntraDay
- VectorVest AutoTester
- VectorVest Educational Services
- VectorVest OnLine
- VectorVest Options Analyzer
- VectorVest ProGraphics v6.0
- VectorVest ProTrader 7
- VectorVest RealTime Derby Tool
- VectorVest Simulator
- VectorVest Variator
- VectorVest Watchdog
