

HOT TOPICS LIST
- MACD
- Fibonacci
- RSI
- Gann
- ADXR
- Stochastics
- Volume
- Triangles
- Futures
- Cycles
- Volatility
- ZIGZAG
- MESA
- Retracement
- Aroon
INDICATORS LIST
LIST OF TOPICS
PRINT THIS ARTICLE
by Matt Blackman
Vaccine sales have exploded but will they keep growing?
Position: N/A
Matt Blackman
Matt Blackman is a full-time technical and financial writer and trader. He produces corporate and financial newsletters, and assists clients in getting published in the mainstream media. Matt has earned the Chartered Market Technician (CMT) designation. Follow Matt on Twitter at www.twitter.com/RatioTrade
PRINT THIS ARTICLE
PROGRESS PATTERN
Moderna - A Vaccine Growth Story
09/30/21 03:03:35 PMby Matt Blackman
Vaccine sales have exploded but will they keep growing?
Position: N/A
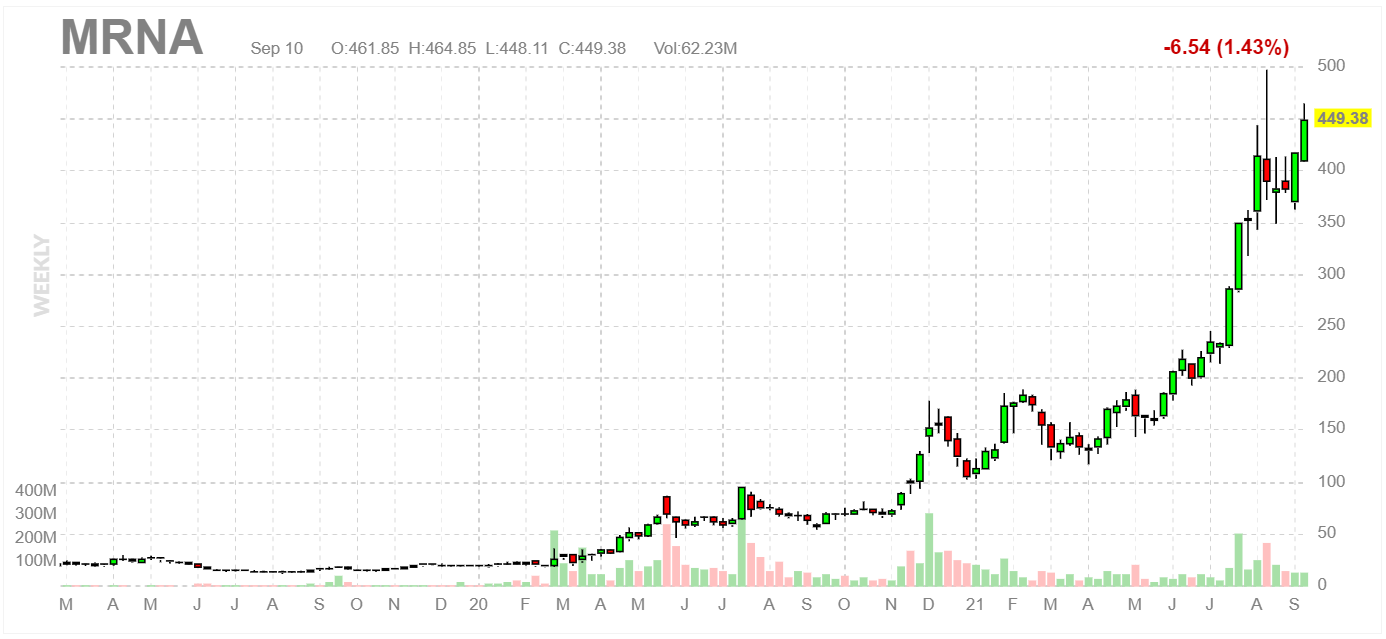
| The last year has been tough on a number of sectors of the economy as companies struggled to deal with Covid-19. But the year has been anything but challenging for Moderna Inc, makers of the mRNA vaccine whose stock has risen more than five-fold in the last year. MRNA began trading on the Nasdaq in December 2018 after launching at $22 per share. |
|
| Figure 1. Weekly chart showing MRNA�s dramatic rise over the last two years. |
| Graphic provided by: https://finviz.com/. |
| |
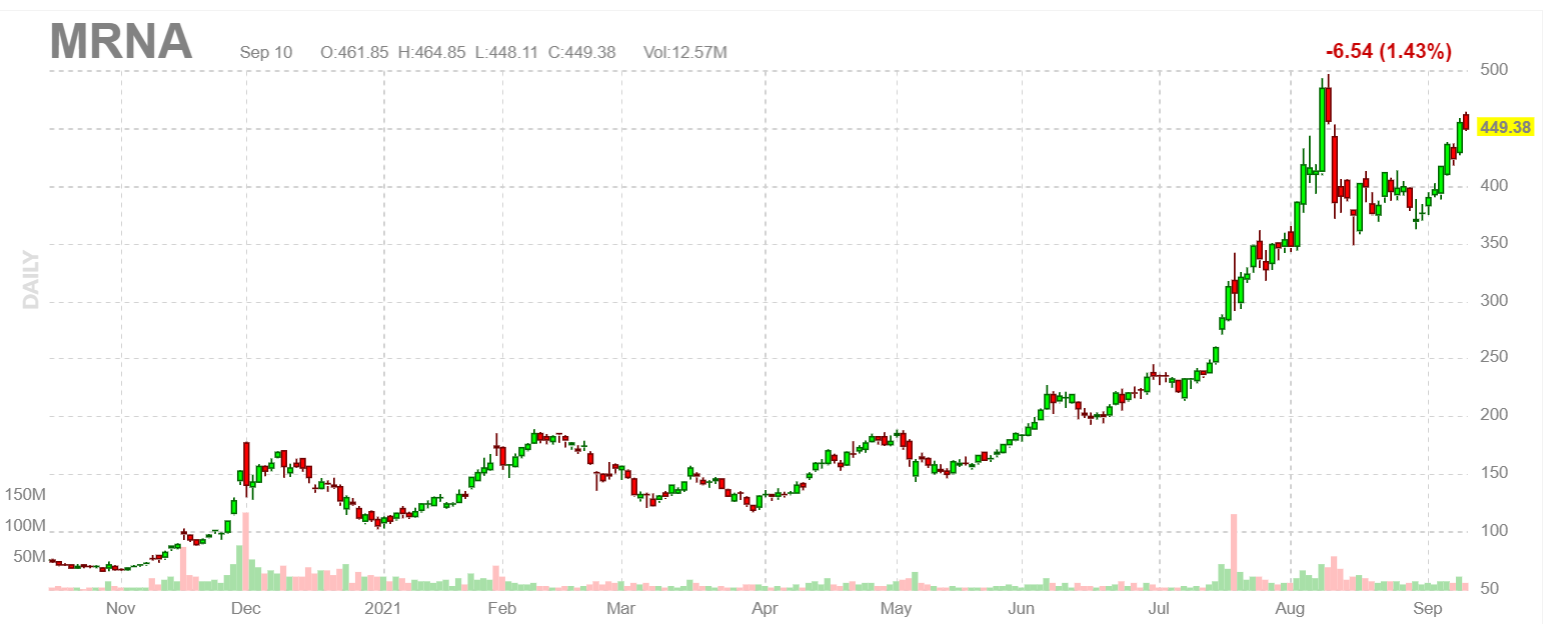
| Fundamentally, MRNA boasts a Price/Earnings ratio of 56.10 and boasts an impressive trailing-twelve month Earnings per Share of $8.01. It does not pay a dividend. Institutions hold more than 57% of the shares while insiders hold 2.4%. Moderna posted earnings for the quarter ending June topped analysts' estimates on revenues of $4.35 billion thanks to $4.2 billion in sales of its covid mRNA coronavirus vaccine according to The Street. The company forecasted vaccine sales of around $20 billion for full-year 2021. As we see in Figure 2, the stock experienced an explosive breakout in July and August 2021 roughly doubling in price. The chart shows a potential cup-and-handle pattern building which if confirmed would be bullish for the stock. |
|
| Figure 2. Moderna daily chart. |
| Graphic provided by: https://finviz.com/. |
| |
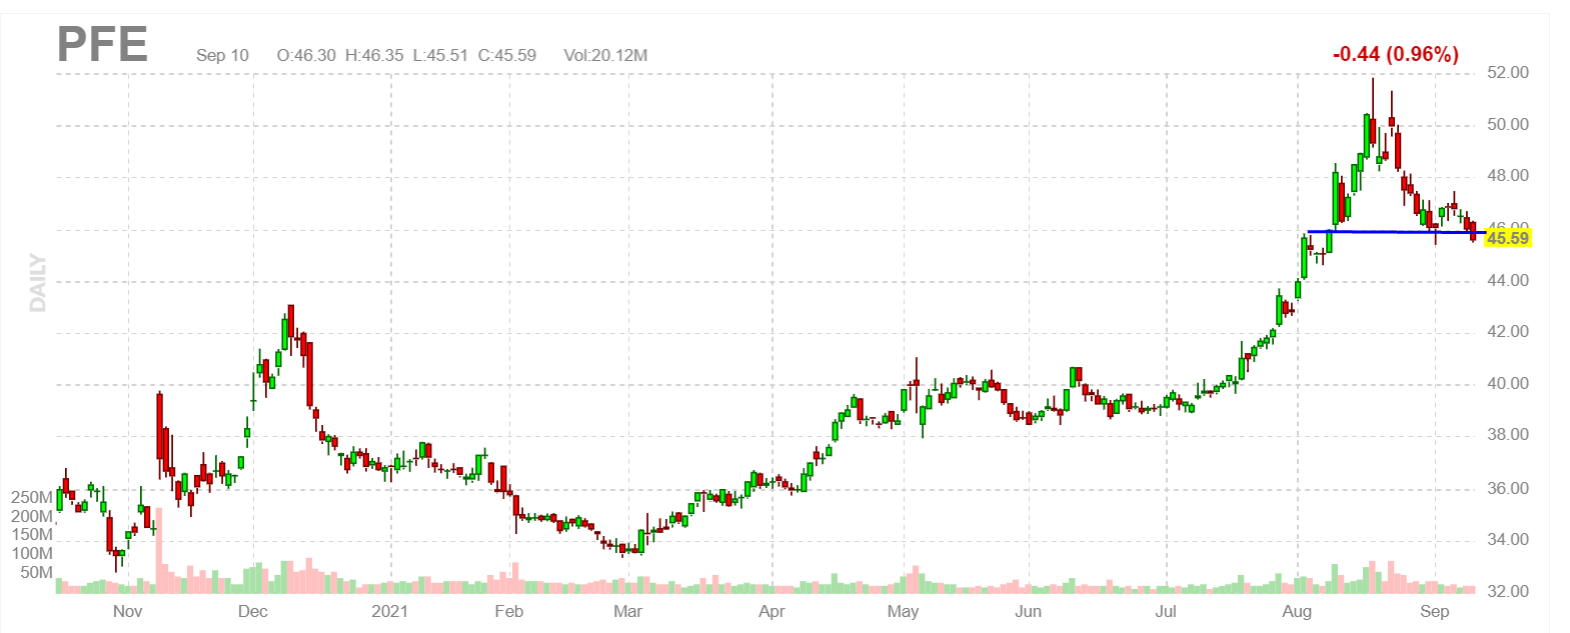
| Fellow mRNA vaccine manufacturer pFizer Inc. has also had a good year if not so impressive as we see in the next chart. However, the chart shows a recent break of support which has bearish implications in the short-term. |
|
| Figure 3. Daily chart of pFizer Inc. showing more muted performance for the stock this year. |
| Graphic provided by: https://finviz.com/. |
| |
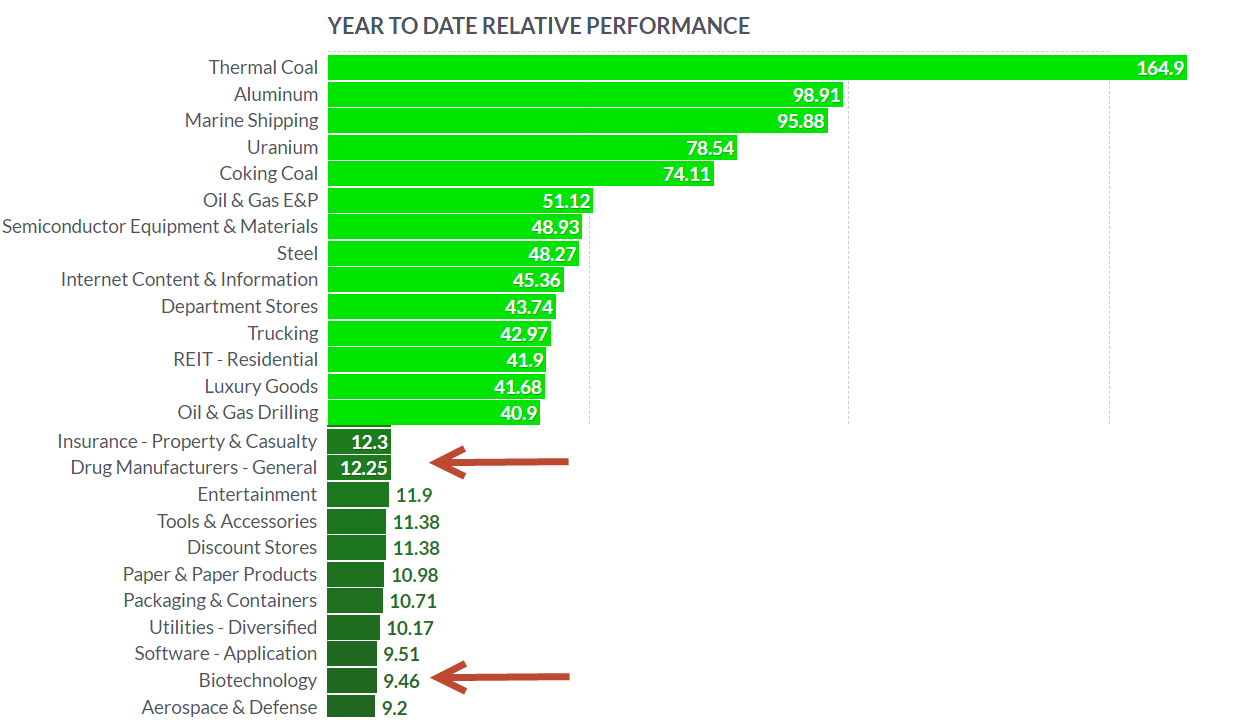
| Year-to-date for Drug Manufacturers that include pFizer and Biotech which includes Moderna are up 12.25 and 9.46% so far (see bar chart below). |
|
| Figure 4. Sector year-to-date performance to September 10, 2021. |
| Graphic provided by: https://finviz.com/. |
| |
| September is the weakest month of the year for stocks so it will be interesting to see if MRNA can continue to outperform. Tracking the formation of the potential Cup and Handle pattern is essential. A break below century level $400 would be bearish. Suggested Reading: Moderna Stock Jumps After Earnings Blowout on $4.2 Billion COVID Vaccine Sales Costco - Steady Eddy Consumer Defense Stock |
Matt Blackman is a full-time technical and financial writer and trader. He produces corporate and financial newsletters, and assists clients in getting published in the mainstream media. Matt has earned the Chartered Market Technician (CMT) designation. Follow Matt on Twitter at www.twitter.com/RatioTrade
| Title: | Author |
| Company: | TradeSystemGuru |
| Address: | Box 2589 |
| Garibaldi Highlands, BC V0N1T0 | |
| Phone # for sales: | 6048989069 |
| E-mail address: | indextradermb@gmail.com |
Traders' Resource Links | |
| TradeSystemGuru has not added any product or service information to TRADERS' RESOURCE. | |
Click here for more information about our publications!
PRINT THIS ARTICLE

Request Information From Our Sponsors
- StockCharts.com, Inc.
- Candle Patterns
- Candlestick Charting Explained
- Intermarket Technical Analysis
- John Murphy on Chart Analysis
- John Murphy's Chart Pattern Recognition
- John Murphy's Market Message
- MurphyExplainsMarketAnalysis-Intermarket Analysis
- MurphyExplainsMarketAnalysis-Visual Analysis
- StockCharts.com
- Technical Analysis of the Financial Markets
- The Visual Investor
- VectorVest, Inc.
- Executive Premier Workshop
- One-Day Options Course
- OptionsPro
- Retirement Income Workshop
- Sure-Fire Trading Systems (VectorVest, Inc.)
- Trading as a Business Workshop
- VectorVest 7 EOD
- VectorVest 7 RealTime/IntraDay
- VectorVest AutoTester
- VectorVest Educational Services
- VectorVest OnLine
- VectorVest Options Analyzer
- VectorVest ProGraphics v6.0
- VectorVest ProTrader 7
- VectorVest RealTime Derby Tool
- VectorVest Simulator
- VectorVest Variator
- VectorVest Watchdog