

HOT TOPICS LIST
- MACD
- Fibonacci
- RSI
- Gann
- ADXR
- Stochastics
- Volume
- Triangles
- Futures
- Cycles
- Volatility
- ZIGZAG
- MESA
- Retracement
- Aroon
INDICATORS LIST
LIST OF TOPICS
PRINT THIS ARTICLE
by Matt Blackman
Fall is coming when corrections and bear markets are known to occur. Is your portfolio ready?
Position: N/A
Matt Blackman
Matt Blackman is a full-time technical and financial writer and trader. He produces corporate and financial newsletters, and assists clients in getting published in the mainstream media. Matt has earned the Chartered Market Technician (CMT) designation. Follow Matt on Twitter at www.twitter.com/RatioTrade
PRINT THIS ARTICLE
MOMENTUM
Costco - Steady Eddy Consumer Defense Stock
09/02/21 05:26:18 PMby Matt Blackman
Fall is coming when corrections and bear markets are known to occur. Is your portfolio ready?
Position: N/A
| As summer winds down and temperatures cool in the Northern Hemisphere, investors and traders prepare for the September through November period when the largest corrections and bear markets often occur. It's safe to say that the return of capital rather than return on capital moves to the top of the list of priorities for many. Many investors and traders view October as the worst month to be in stocks. However, September should be the real concern according to the data. According to this study September S&P 500 losses have averaged one percent over the last 92 years. And losing Septembers outnumbered winners by a ratio of 49 to 42. Octobers on the other hand, showed an average gain, albeit muted, of +0.4% over the period. Interestingly, the best month was July at +1.6% followed closely by April at +1.5%. Aprils also had the best win/loss ratio at 59/33. |
|
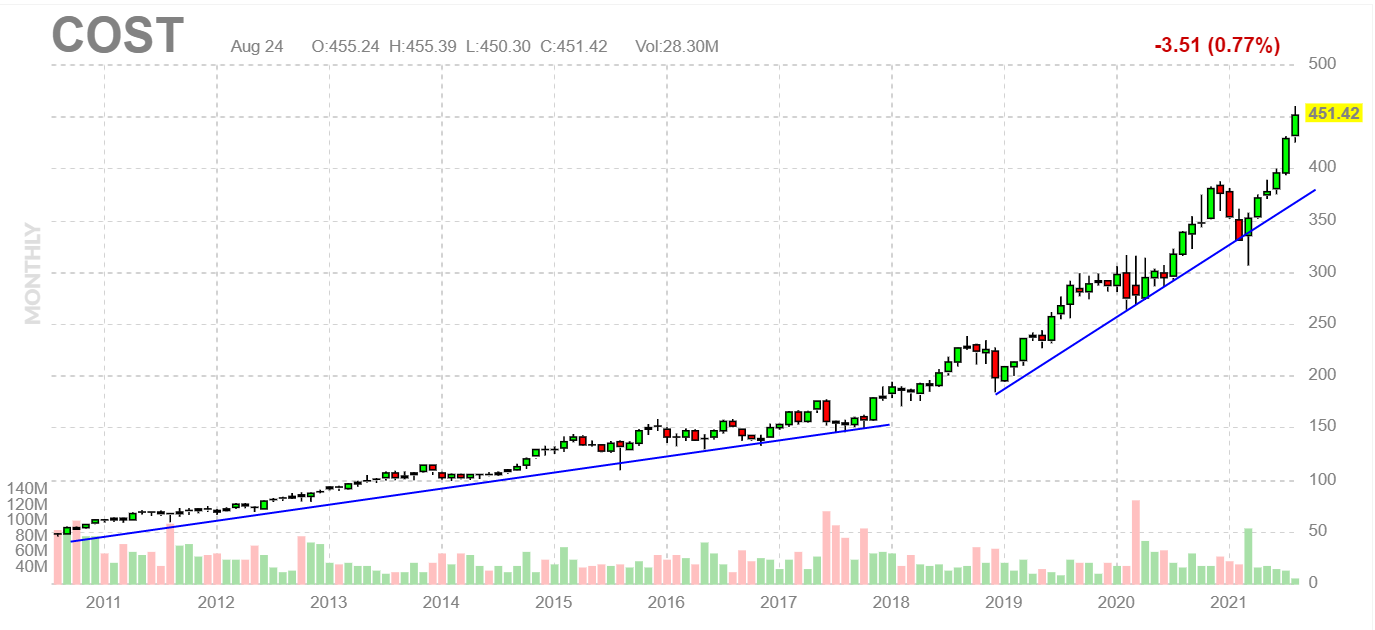
| Figure 1. Monthly chart of Costco Wholesale Corporation (COST) showing strongly up trend support since 2011. |
| Graphic provided by: https://finviz.com/. |
| |
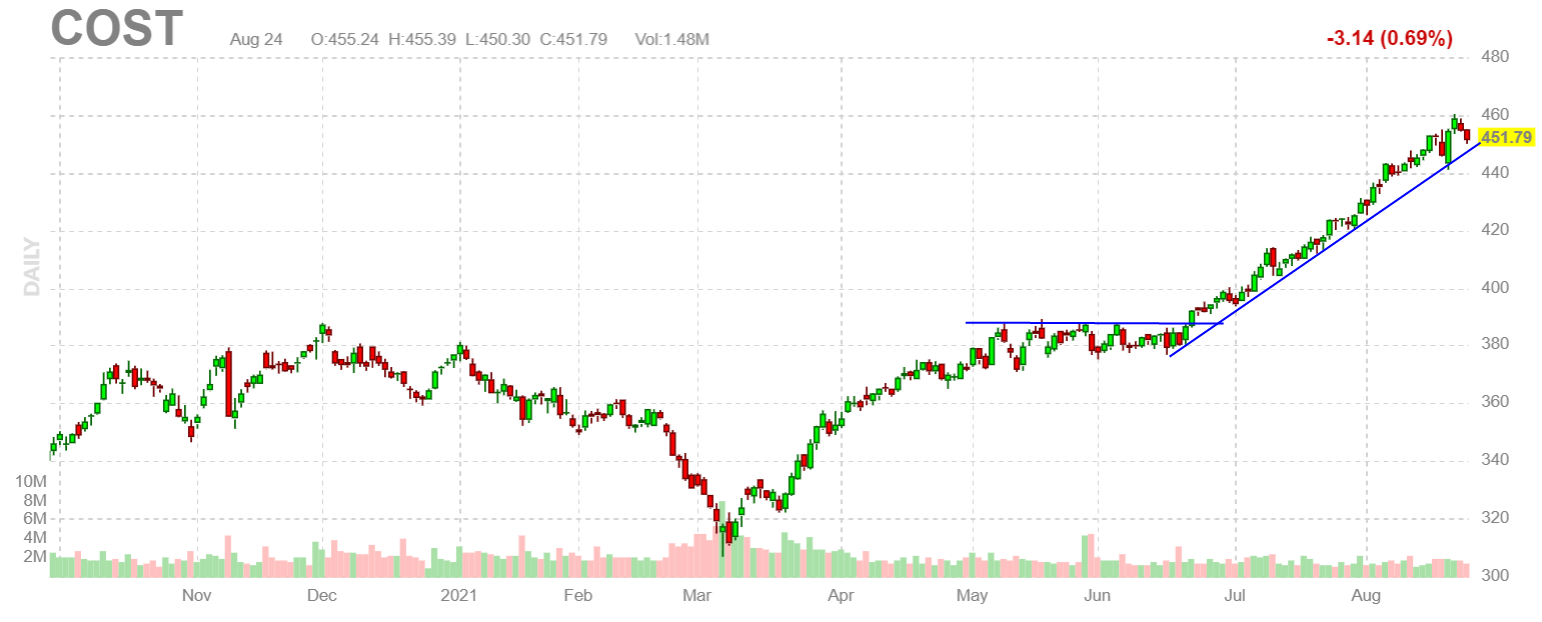
| Sectors that tend do better when the economy is slowing and suffer least when spending falls and consumers hunker down with life's necessities: Utilities, Telecommunications, Healthcare and Consumer Staples. One stock that has performed well through both good times and bad is Costco Wholesale Corporation. As we see from Figure 1, it has been in a strong up trend for the last decade and showed respectable growth between 2010 and 2018 more than tripling over the period. It then appears to have changed gears from there more than doubling in a little over three years. And as we see from Figures 1 and 2, the stock has been on fire since June 2021. |
|
| Figure 2. Daily chart of COST showing the last correction in February-March 2021 and solid performance since. |
| Graphic provided by: https://finviz.com/. |
| |
| Fundamentally, COST has a Price/Earnings ratio of 42.48, a Price Earnings Growth (PEG) of 4.01 and has seen its Earnings per Share (EPS) rise 12.90% in the last year. So what can we expect this September? Between 2011 and 2020, COST gained ground in seven Septembers and lost in three so it has a good track record in the worst month of the year. But the stock is already up more than 35% since March 2021 so may be in need of a rest. Based on its long-term performance profile, if COST does drop this fall, it would likely provide an excellent opportunity to buy the stock or pick up more if you already own it! |
| Suggested Reading: Is the Stock Market's October Effect Real? Market Cycle Trifecta - What Are The Three Asset Classes Telling Us? What Are Defensive Sector Funds? |
Matt Blackman is a full-time technical and financial writer and trader. He produces corporate and financial newsletters, and assists clients in getting published in the mainstream media. Matt has earned the Chartered Market Technician (CMT) designation. Follow Matt on Twitter at www.twitter.com/RatioTrade
| Title: | Author |
| Company: | TradeSystemGuru |
| Address: | Box 2589 |
| Garibaldi Highlands, BC V0N1T0 | |
| Phone # for sales: | 6048989069 |
| E-mail address: | indextradermb@gmail.com |
Traders' Resource Links | |
| TradeSystemGuru has not added any product or service information to TRADERS' RESOURCE. | |
Click here for more information about our publications!
Comments
Date:�10/17/21Rank:�4Comment:�

Request Information From Our Sponsors
- StockCharts.com, Inc.
- Candle Patterns
- Candlestick Charting Explained
- Intermarket Technical Analysis
- John Murphy on Chart Analysis
- John Murphy's Chart Pattern Recognition
- John Murphy's Market Message
- MurphyExplainsMarketAnalysis-Intermarket Analysis
- MurphyExplainsMarketAnalysis-Visual Analysis
- StockCharts.com
- Technical Analysis of the Financial Markets
- The Visual Investor
- VectorVest, Inc.
- Executive Premier Workshop
- One-Day Options Course
- OptionsPro
- Retirement Income Workshop
- Sure-Fire Trading Systems (VectorVest, Inc.)
- Trading as a Business Workshop
- VectorVest 7 EOD
- VectorVest 7 RealTime/IntraDay
- VectorVest AutoTester
- VectorVest Educational Services
- VectorVest OnLine
- VectorVest Options Analyzer
- VectorVest ProGraphics v6.0
- VectorVest ProTrader 7
- VectorVest RealTime Derby Tool
- VectorVest Simulator
- VectorVest Variator
- VectorVest Watchdog