

HOT TOPICS LIST
- MACD
- Fibonacci
- RSI
- Gann
- ADXR
- Stochastics
- Volume
- Triangles
- Futures
- Cycles
- Volatility
- ZIGZAG
- MESA
- Retracement
- Aroon
INDICATORS LIST
LIST OF TOPICS
PRINT THIS ARTICLE
by Mark Rivest
US stocks have rallied into a potentially bearish time zone.
Position: Sell
Mark Rivest
Independent investment advisor, trader and writer. He has written articles for Technical Analysis of Stocks & Commodities, Traders.com Advantage,Futuresmag.com and, Finance Magnates. Author of website Four Dimension Trading.
PRINT THIS ARTICLE
MARKET TIMING
The Bearish Time
09/09/21 03:02:51 PMby Mark Rivest
US stocks have rallied into a potentially bearish time zone.
Position: Sell
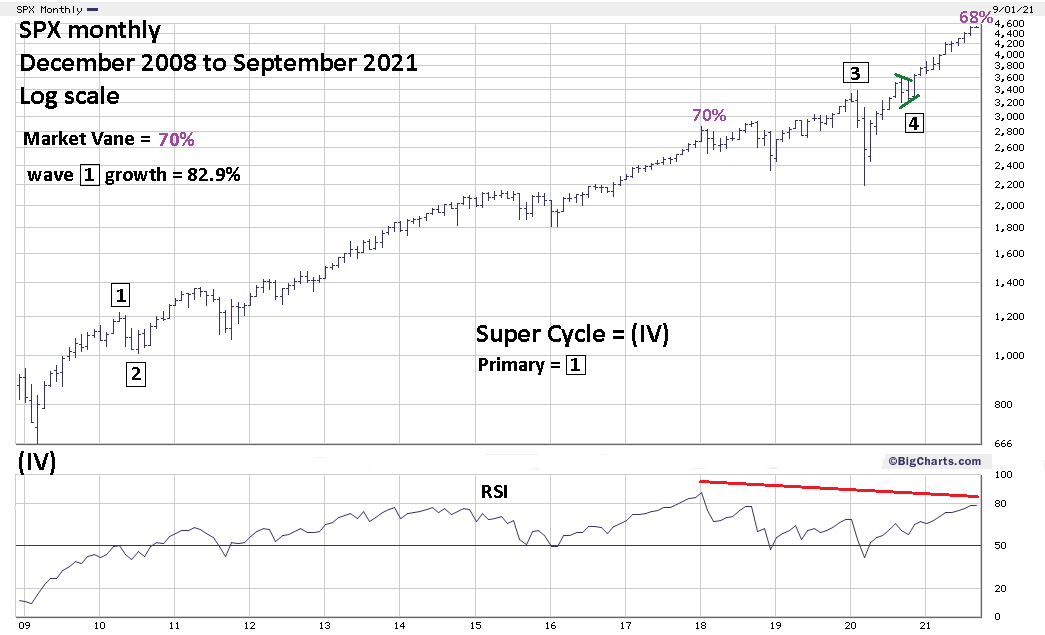
| Since March of 2020 US stocks have been in one of the most powerful and persistent rallies in history. Since April 2021 several sentiment and momentum indicators have had very bearish readings, yet the rally continues. In early September 2021 momentum and sentiment remain bearish. With a looming bearish season from September to October, time now becomes the most important factor. Momentum and Sentiment There are several long and short-term momentum oscillators with bearish divergences. Internal stock market indicators such as new-52-week highs are also showing bearish divergences. For brevity the focus on momentum for this article will be the RSI. Please see the monthly S&P 500 (SPX) chart illustrated in Figure 1. For stocks and stock indices, RSI almost always signals tops with at least one bearish divergence. A maximum RSI reading even deeply into the overbought zone most likely signals a continuation of the bull trend. The RSI overbought zone begins at 70%. The monthly RSI as of early September 2021 is at 78% and has a bearish divergence vs. the RSI secular bull market maximum recorded in early 2018. The long-term bearish divergence with a reading in the overbought zone implies a major peak could be forming. If the monthly RSI were to exceed the early 2018 reading it could indicate a continuation of the bull trend for at least several months. Short-term sentiment indicators VIX and Put/Call ratio as of early September 2021 have bearish divergences. Market Vane Bullish Consensus has a long-term bearish divergence. Market Vane Corporation developed the Bullish Consensus which is derived by tracking the buy and sell recommendations of leading commodity futures market advisers. Tops are indicated with high Bullish Consensus reading. Bottoms can occur with low Bullish Consensus readings. For US stocks significant peaks are usually associated with reading in the low to mid 60% range. The maximum Market Vane reading for the secular bull market that began in March 2009 was 70% and occurred at the same time as the maximum RSI reading in early 2018. The reading for the week of August 30 to September 3 was 68% diverging against the early 2018 reading with the lower price peak made in early 2018. A long-term bearish divergence within the overbought zone. |
|
| Figure 1. The long-term bearish divergence with a reading in the overbought zone implies a major peak could be forming. |
| Graphic provided by: BigCharts.com. |
| |
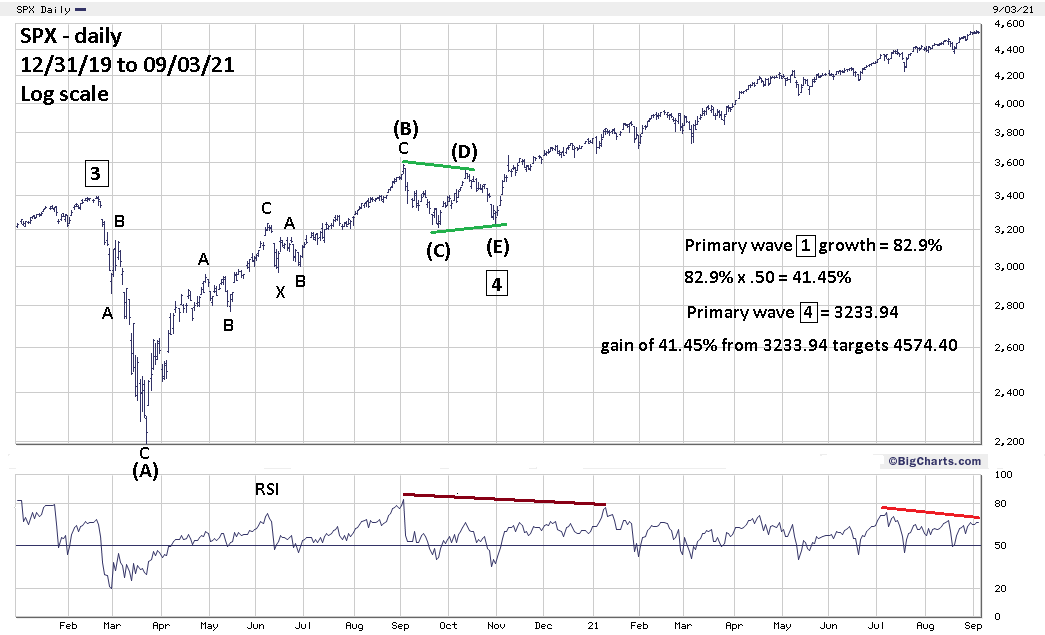
| Price Proper use of the Elliott wave methodology requires an understanding of alternate wave counts. There's no predestination in the markets and the mass mind can change direction the same as an individual. Many times, there could be two or more patterns a market can take, so determining the correct wave count is essential to forecasting potential trend changes. My June 30, 2021, article "Fibonacci Price and Time Relationships" noted that the SPX March 23, 2020, to April 29, 2020, rally could be Intermediate wave (1) of the 2020 to 2021 bull phase. This is still a valid wave count however there's an alternate wave count. Please see the daily SPX daily illustrated in Figure 2. Another wave count has an Elliott wave Horizonal Triangle from the February 2020 peak to late October 2020 correction bottom. This wave count changes the long-term Fibonacci price forecast. Sometimes in a rising market, the Fibonacci price calculations to forecast the termination point of the next wave can be made at the low of the Horizontal Triangle, in this case Intermediate wave (A). However, most of the time the calculation begins at the end of the Horizontal Triangle, termination point of wave "E". Within Elliott motive waves there's usually a Fibonacci relationship between wave "one" and "five". When measuring large percentage gain movements Fibonacci comparisons are best made by examining growth rates. The monthly SPX chart in Figure 1 shows the supposed Primary wave "1" had a growth rate of 82.9%. Multiplied by the Fibonacci ratio of .50 yields a growth rate of 41.45%, adding this growth to the bottom of Intermediate wave (E) targets SPX 4574.40. Also note the deteriorating momentum readings from the daily RSI. |
|
| Figure 2. Note the deteriorating momentum readings from the daily RSI. |
| Graphic provided by: BigCharts.com. |
| |
| Time Some of the most important tops in US stock market history have occurred in the late August to early September time zone. September 3, 1929, was the high point of the massive Dow Jones Industrial Average (DJIA) bull market. What followed was a crash and a nearly three-year bear market. August 25, 1987, was the peak of a five-year bull market for the SPX and DJIA. Subsequently there was a crash. September 1, 2000, was the second peak of an SPX double top, and September 6, 2000, was the DJIA September 2000 top. What followed was a two-year bear market. Lunar phases can sometimes signal trend changes. For stocks new moons usually indicate potential tops, full moons bottoms. There was a new moon September 7, 2021. Broader seasonal patterns for US stocks are bearish from late August until October. |
| Four Dimension Sell Signals Indicators from the dimensions of sentiment and momentum are bearish. Within the price dimension the SPX as of September 2, 2021, has reached 4545.85, near potential major Fibonacci resistance at 4574.40. Considering that the coordinates for this calculation are from a much lower area more than ten-years ago, the SPX has reached leeway of the bullseye target. All of this is occurring at what's probably the most bearish season in the time dimension. With a bearish set up from all four market dimensions, the probabilities are high that US stocks could have at least a 10% decline or larger sometime in September to October 2021. Further Reading: Frost A.J and Robert Prechter (1985) "Elliott Wave Principle", New Classics Library. |
Independent investment advisor, trader and writer. He has written articles for Technical Analysis of Stocks & Commodities, Traders.com Advantage,Futuresmag.com and, Finance Magnates. Author of website Four Dimension Trading.
| Website: | www.fourdimensiontrading.com |
| E-mail address: | markrivest@gmail.com |
Click here for more information about our publications!
PRINT THIS ARTICLE

Request Information From Our Sponsors
- VectorVest, Inc.
- Executive Premier Workshop
- One-Day Options Course
- OptionsPro
- Retirement Income Workshop
- Sure-Fire Trading Systems (VectorVest, Inc.)
- Trading as a Business Workshop
- VectorVest 7 EOD
- VectorVest 7 RealTime/IntraDay
- VectorVest AutoTester
- VectorVest Educational Services
- VectorVest OnLine
- VectorVest Options Analyzer
- VectorVest ProGraphics v6.0
- VectorVest ProTrader 7
- VectorVest RealTime Derby Tool
- VectorVest Simulator
- VectorVest Variator
- VectorVest Watchdog
- StockCharts.com, Inc.
- Candle Patterns
- Candlestick Charting Explained
- Intermarket Technical Analysis
- John Murphy on Chart Analysis
- John Murphy's Chart Pattern Recognition
- John Murphy's Market Message
- MurphyExplainsMarketAnalysis-Intermarket Analysis
- MurphyExplainsMarketAnalysis-Visual Analysis
- StockCharts.com
- Technical Analysis of the Financial Markets
- The Visual Investor