

HOT TOPICS LIST
- MACD
- Fibonacci
- RSI
- Gann
- ADXR
- Stochastics
- Volume
- Triangles
- Futures
- Cycles
- Volatility
- ZIGZAG
- MESA
- Retracement
- Aroon
INDICATORS LIST
LIST OF TOPICS
PRINT THIS ARTICLE
by Mark Rivest
Could long-term Fibonacci relationships identify a major top for US stocks?
Position: Sell
Mark Rivest
Independent investment advisor, trader and writer. He has written articles for Technical Analysis of Stocks & Commodities, Traders.com Advantage,Futuresmag.com and, Finance Magnates. Author of website Four Dimension Trading.
PRINT THIS ARTICLE
FIBONACCI
Fibonacci Price And Time Relationships
06/30/21 02:37:31 PMby Mark Rivest
Could long-term Fibonacci relationships identify a major top for US stocks?
Position: Sell
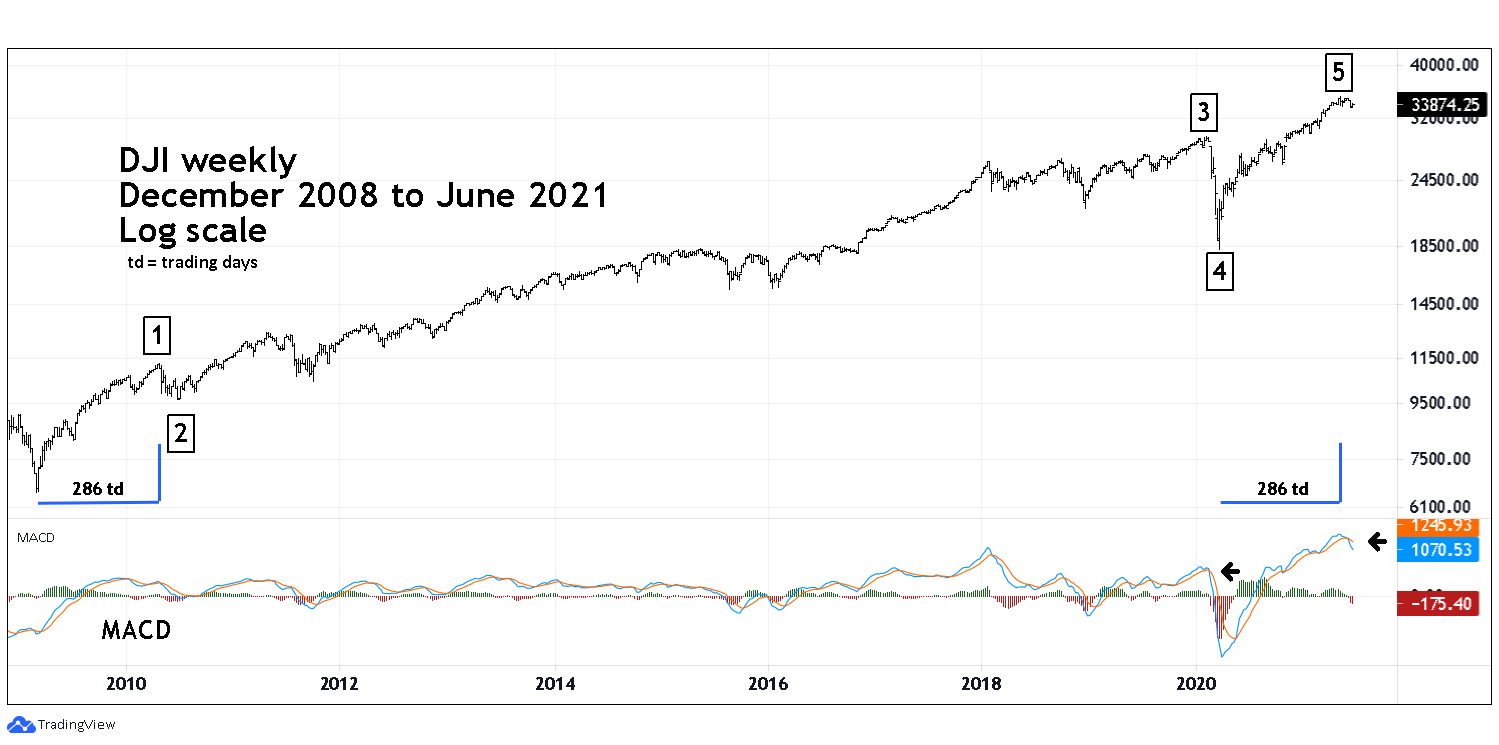
| All Elliott wave structures are composed of sub patterns. Fibonacci price/time relationships among the sub patterns can be used to forecasts market turning points. Long and intermediate-term price/time relationships for the Dow Jones Industrial Average (DJI) and S&P 500 (SPX) point to a potential major US stock market top. Dow Jones Industrial Average - Weekly Please see the weekly DJI chart illustrated in Figure 1. Within an Elliott five-wave impulse pattern there's usually a price/time relationship between waves "one" and "five". The supposed Primary wave "1"-boxed lasted from 03/06/09 to 04/26/10 — 286 trading days. Adding 286 trading days to the supposed Primary wave "4" bottom of 03/23/20 targets 05/11/21 — the DJI high was 05/10/21. Additionally, stocks occasionally make tops at or near new moons — 05/11/21 was a new moon. Subsequent to the May peak, DJI weekly MACD registered the most significant bearish lines crossover since the February 2020 top. |
|
| Figure 1. Adding 286 trading days to the supposed Primary wave "4" bottom of 03/23/20 targets 05/11/21. |
| Graphic provided by: TradingView. |
| |
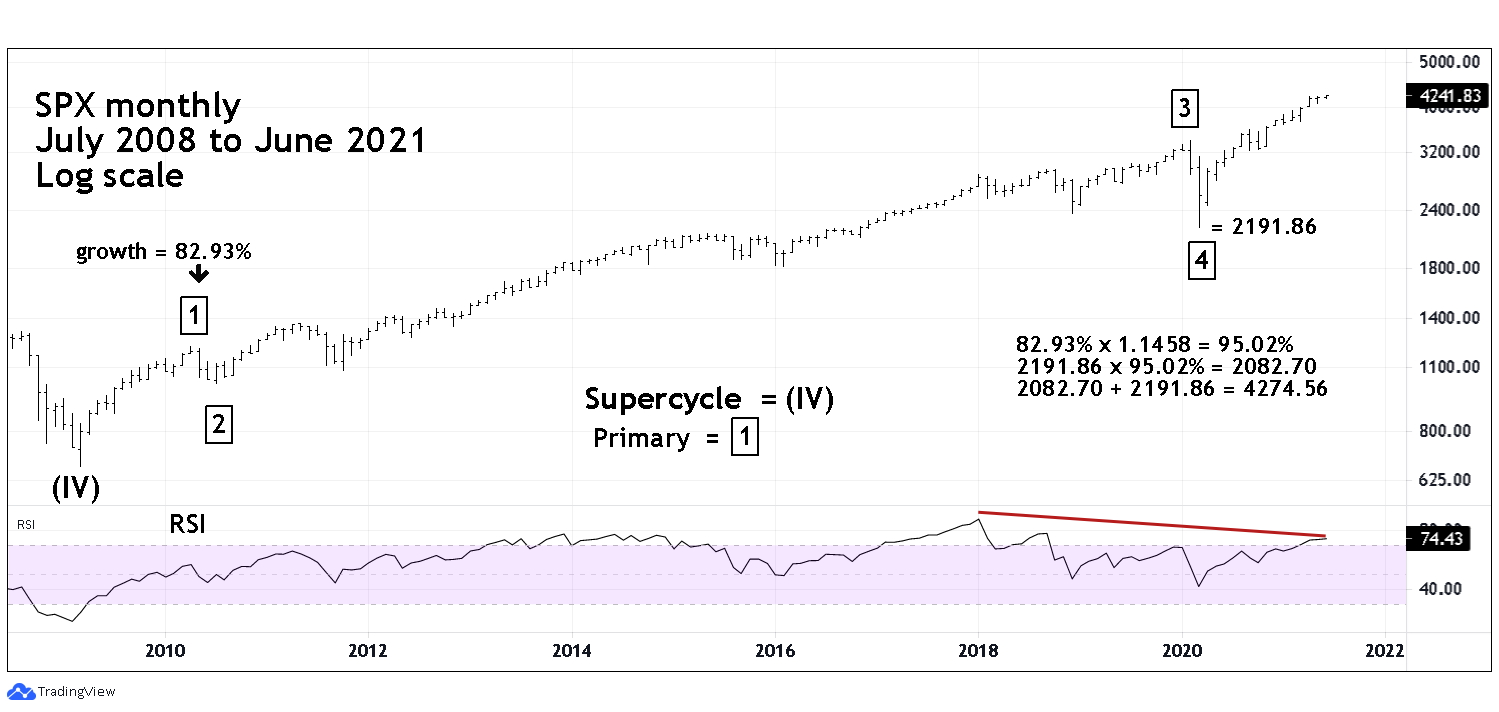
| S&P 500 - Monthly Major and intermediate stock market tops are usually spread out. The major US stock market peak in early 2000 is a classic example. The DJI bull market top was in January 2000. The SPX and Nasdaq Composite completed their respective bull runs in March 2000. The same phenomenon could be happening in 2021. As of 06/23/21 the SPX all-time high was made 06/15/21. The Nasdaq Composite made a new all-time high on 06/23/21. The two most common Fibonacci relationships are equality (1/1) and .618. The .618 Fibonacci ratio is called the Golden Ratio. The next most common relationship is .382 (.618 x .618 = .382.).Below that is .236 (.382 x .618 = .236). The next relationship is .1458 (.236 x .618 = .1458) which is rare but could be a factor in long and intermediate-term forecasting. Please see the monthly SPX chart illustrated in Figure 2. Several of my articles speculated that the supposed SPX Primary wave one from March 2009 to April 2010 could have a growth rate that equals Primary wave "5". The target price where a growth rate of 82.9% from the supposed Primary wave "4" is SPX 4008. A problem with this target is that it's almost at the too obvious 4000. Additionally, as the SPX neared 4000 there was a short-term daily rising trendline crossing at 4000. Subsequently the bulls launched a successful attack on stop buy orders just above 4000. This action blasted prices beyond the 1/1 Fibonacci ratio and into the orbit of the next higher ratio of 1.1458. The growth rate of Primary wave "one" 82.93% x 1.1458 is 95.02%, adding this growth rate to the bottom of Primary wave "4" targets SPX 4274.59. The SPX high on 06/15/21 was 4257.16 a difference of 17.43 points or 0.04%. |
|
| Figure 2. Major and intermediate stock market tops are usually spread out. |
| Graphic provided by: TradingView. |
| |
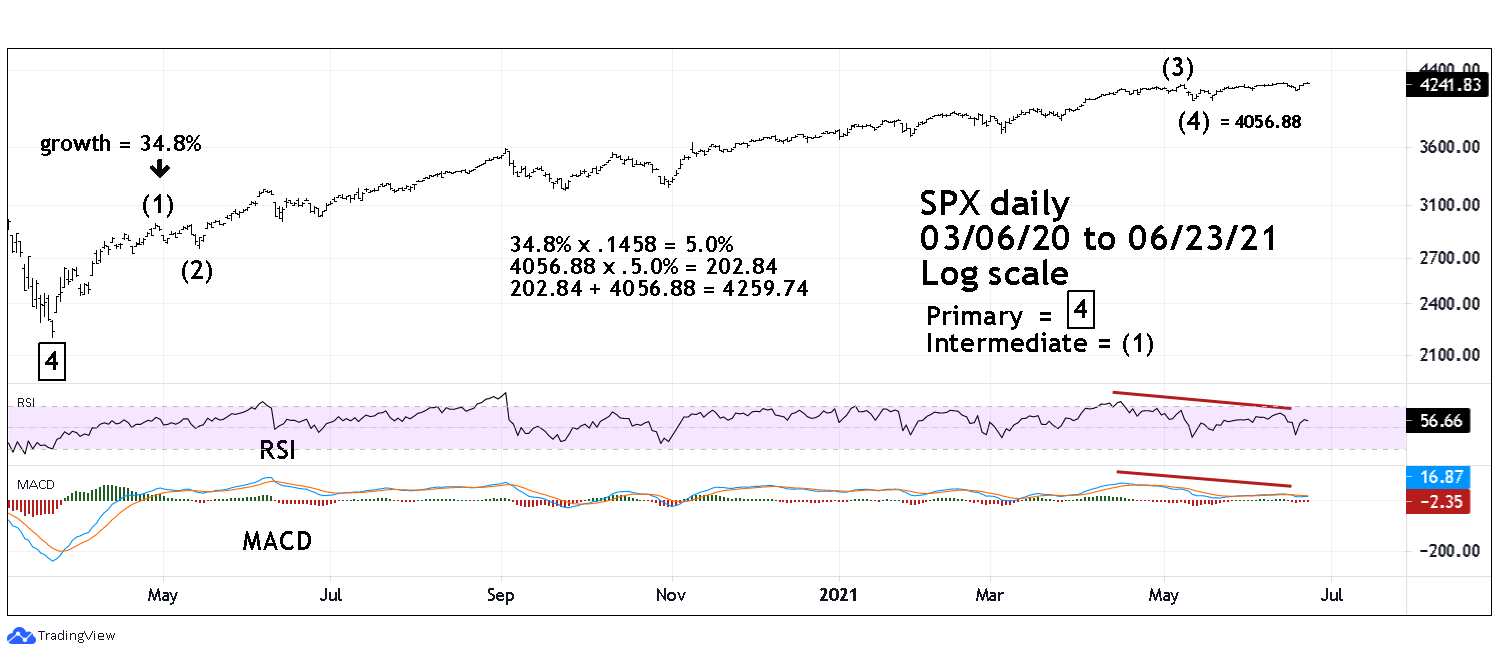
| S&P 500 - Daily There's usually a Fibonacci relationship within a sub-wave that corresponds to the larger Fibonacci coordinate. The daily SPX chart illustrated in Figure 3 shows a sub wave Fibonacci relationship. The growth rate of the supposed Intermediate wave (1) was 34.8% x .1458 = 5.0%. Adding this growth rate to the supposed Intermediate wave (4) of 4056.88 targets SPX 4259.74, almost an exact hit of the 06/15/21 peak at 4257.16. Note the significant SPX RSI bearish divergence which corresponds to the monthly RSI bearish divergence. Daily MACD also has a bearish divergence and a bearish lines crossover. |
|
| Figure 3. There�s usually a Fibonacci relationship within a sub wave that corresponds to the larger Fibonacci coordinate. |
| Graphic provided by: TradingView. |
| |
| Long-term Consequences If the DJI Fibonacci time relationship and the SPX Fibonacci price relationship hold, it could be powerful evidence that the secular bull market from March 2009 is complete. Both the DJI and SPX have what counts as a five-wave impulse pattern 2009 to 2021. If this pattern is complete, it implies a subsequent corrective pattern that corresponds in price/time to the eleven-year bull market. In time - the next bear market could last from three to five years, possibly longer. Retracement of the bull market progress could be from 50 to 60%, possibly deeper. US stocks are seasonally bearish from early May until October. As of mid-June prices have held up. If new highs are not made the next decline could be the start of a long and deep bear market. Further Reading: Frost A.J and Robert Prechter (1985) "Elliott Wave Principle", New Classics Library. |
Independent investment advisor, trader and writer. He has written articles for Technical Analysis of Stocks & Commodities, Traders.com Advantage,Futuresmag.com and, Finance Magnates. Author of website Four Dimension Trading.
| Website: | www.fourdimensiontrading.com |
| E-mail address: | markrivest@gmail.com |
Click here for more information about our publications!
Comments

Request Information From Our Sponsors
- StockCharts.com, Inc.
- Candle Patterns
- Candlestick Charting Explained
- Intermarket Technical Analysis
- John Murphy on Chart Analysis
- John Murphy's Chart Pattern Recognition
- John Murphy's Market Message
- MurphyExplainsMarketAnalysis-Intermarket Analysis
- MurphyExplainsMarketAnalysis-Visual Analysis
- StockCharts.com
- Technical Analysis of the Financial Markets
- The Visual Investor
- VectorVest, Inc.
- Executive Premier Workshop
- One-Day Options Course
- OptionsPro
- Retirement Income Workshop
- Sure-Fire Trading Systems (VectorVest, Inc.)
- Trading as a Business Workshop
- VectorVest 7 EOD
- VectorVest 7 RealTime/IntraDay
- VectorVest AutoTester
- VectorVest Educational Services
- VectorVest OnLine
- VectorVest Options Analyzer
- VectorVest ProGraphics v6.0
- VectorVest ProTrader 7
- VectorVest RealTime Derby Tool
- VectorVest Simulator
- VectorVest Variator
- VectorVest Watchdog