

HOT TOPICS LIST
- MACD
- Fibonacci
- RSI
- Gann
- ADXR
- Stochastics
- Volume
- Triangles
- Futures
- Cycles
- Volatility
- ZIGZAG
- MESA
- Retracement
- Aroon
INDICATORS LIST
LIST OF TOPICS
PRINT THIS ARTICLE
by Mark Rivest
An important turn point could forecast the end of the bull market.
Position: N/A
Mark Rivest
Independent investment advisor, trader and writer. He has written articles for Technical Analysis of Stocks & Commodities, Traders.com Advantage,Futuresmag.com and, Finance Magnates. Author of website Four Dimension Trading.
PRINT THIS ARTICLE
FIBONACCI
S&P 500 - Nexus Point
08/19/21 04:58:07 PMby Mark Rivest
An important turn point could forecast the end of the bull market.
Position: N/A
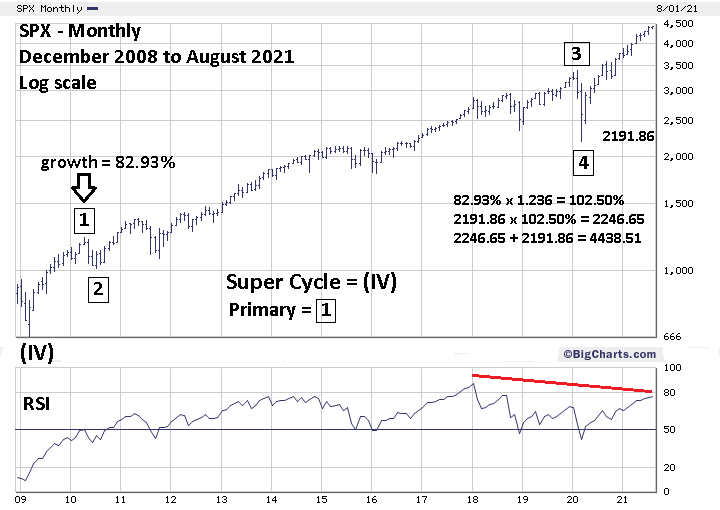
| Fibonacci retracement/extensions are used to determine market support/resistance levels. Two Fibonacci extension methods indicate the S&P 500 (SPX) could have significant resistance in the mid 4400 area. If the resistance zone holds it could be the prelude to at least a multi-month bear market. S&P 500 - Since 2009 Within Elliott motive waves there's usually a Fibonacci relationship between waves "one" and "five". Some of the Fibonacci ratios are .145, .236, .382, .50, and .618. Some inverse Fibonacci ratios are, 1.145, 1.236, 1.382, 1.50, and 1.618. My June 30, 2021, article "Fibonacci Price And Time Relationships" speculated that the SPX bull move from March 2009 to 2021 was a developing Elliott five wave impulse pattern that could be reaching completion in 2021. The SPX March 2009 to April 2010 rally is the supposed Primary wave "1" of the eleven-year impulse pattern. The June article speculated that primary wave "1" could be related to Primary wave "5" by the Fibonacci inverse ratio of 1.145 that targeted SPX 4274.54 as a termination point for Primary wave "5". Subsequently this level was exceeded, opening the door for a movement to the next higher Fibonacci inverse ratio of 1.236. Please see the updated Monthly SPX chart illustrated in Figure 1. Usually when measuring large percentage gain movements, comparison of growth rates is used to forecast termination points. The growth of Primary wave "1" was 82.93% multiplied by the Fibonacci inverse ratio of 1.236 yields a growth rate of 102.50% added to the supposed Primary wave "4" bottom targets SPX 4438.51 as the Primary wave "5" peak. |
|
| Figure 1. SPX Monthly. Within Elliott motive waves there�s usually a Fibonacci relationship between waves "one" and "five". |
| Graphic provided by: BigCharts.com. |
| |
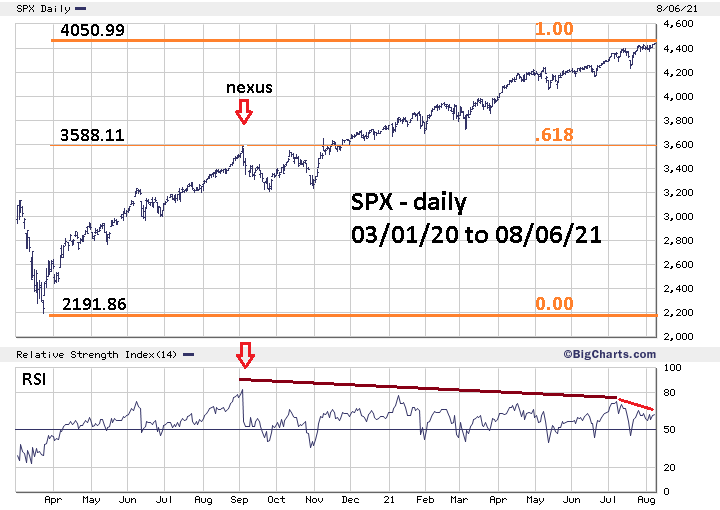
| S&P 500 - 2020 to 2021 R.N Elliott noted that when using trend lines to discover Elliott wave patterns both Arithmetic and Logarithmic charts were applicable. The same concept could be used when making Fibonacci projections. Please see the Daily SPX chart illustrated in Figure 2. Using Arithmetic scale reveals an interesting Fibonacci relationship for the SPX bull market from March 23, 2020 to August 2021. The September 2, 2020, peak was the highest point just before the so far largest correction within the March 2020 to August 2021 bull market. The September 2 top also represents maximum upside momentum as measured by the daily RSI. These two factors make the September 2, 2020, top as a possible nexus point separating the entire bull market into Fibonacci segments. The price distance from the start of the rally on 03/23/20 to the 09/02/20 peak is 1396.25 points, multiplied by the Fibonacci ratio of .618 calculates to 862.88 points, added to the 09/02/20 peak at 3588.11 targets SPX 4450.99 as a potential top for the second section of the bull market. This is within leeway of the Fibonacci Primary wave "5" resistance at 4438.51. Two nearby Fibonacci coordinates represents potentially very powerful resistance. |
|
| Figure 2. SPX Daily. The September 2 top also represents maximum upside momentum as measured by the daily RSI. |
| Graphic provided by: BigCharts.com. |
| |
| Combination of Price, Time , and Momentum The monthly RSI readings from 2009 to 2021 have a significant bearish divergence implying weakening long-term upside momentum. The daily RSI from 2020 has a double bearish divergence, hinting that a decline could commence soon. Broader seasonal patterns for US stocks are bearish from late April to October. In years when US stocks have continued to rally after late April, significant peaks can occur in August. As of early August 2021, the SPX has rallied into potentially powerful resistance with weakening momentum in a seasonal topping zone. The US stock market could be on the verge of a sharp decline lasting until at least October 2021. Further Reading: Frost A.J and Robert Prechter (1985) "Elliott Wave Principle", New Classics Library. |
Independent investment advisor, trader and writer. He has written articles for Technical Analysis of Stocks & Commodities, Traders.com Advantage,Futuresmag.com and, Finance Magnates. Author of website Four Dimension Trading.
| Website: | www.fourdimensiontrading.com |
| E-mail address: | [email protected] |
Click here for more information about our publications!
PRINT THIS ARTICLE

Request Information From Our Sponsors
- StockCharts.com, Inc.
- Candle Patterns
- Candlestick Charting Explained
- Intermarket Technical Analysis
- John Murphy on Chart Analysis
- John Murphy's Chart Pattern Recognition
- John Murphy's Market Message
- MurphyExplainsMarketAnalysis-Intermarket Analysis
- MurphyExplainsMarketAnalysis-Visual Analysis
- StockCharts.com
- Technical Analysis of the Financial Markets
- The Visual Investor
- VectorVest, Inc.
- Executive Premier Workshop
- One-Day Options Course
- OptionsPro
- Retirement Income Workshop
- Sure-Fire Trading Systems (VectorVest, Inc.)
- Trading as a Business Workshop
- VectorVest 7 EOD
- VectorVest 7 RealTime/IntraDay
- VectorVest AutoTester
- VectorVest Educational Services
- VectorVest OnLine
- VectorVest Options Analyzer
- VectorVest ProGraphics v6.0
- VectorVest ProTrader 7
- VectorVest RealTime Derby Tool
- VectorVest Simulator
- VectorVest Variator
- VectorVest Watchdog