

HOT TOPICS LIST
- MACD
- Fibonacci
- RSI
- Gann
- ADXR
- Stochastics
- Volume
- Triangles
- Futures
- Cycles
- Volatility
- ZIGZAG
- MESA
- Retracement
- Aroon
INDICATORS LIST
LIST OF TOPICS
PRINT THIS ARTICLE
by Mark Rivest
Could Nasdaq internal weakness lead to a bear market?
Position: N/A
Mark Rivest
Independent investment advisor, trader and writer. He has written articles for Technical Analysis of Stocks & Commodities, Traders.com Advantage,Futuresmag.com and, Finance Magnates. Author of website Four Dimension Trading.
PRINT THIS ARTICLE
MOMENTUM
Nasdaq Leads The Way
08/05/21 05:05:56 PMby Mark Rivest
Could Nasdaq internal weakness lead to a bear market?
Position: N/A
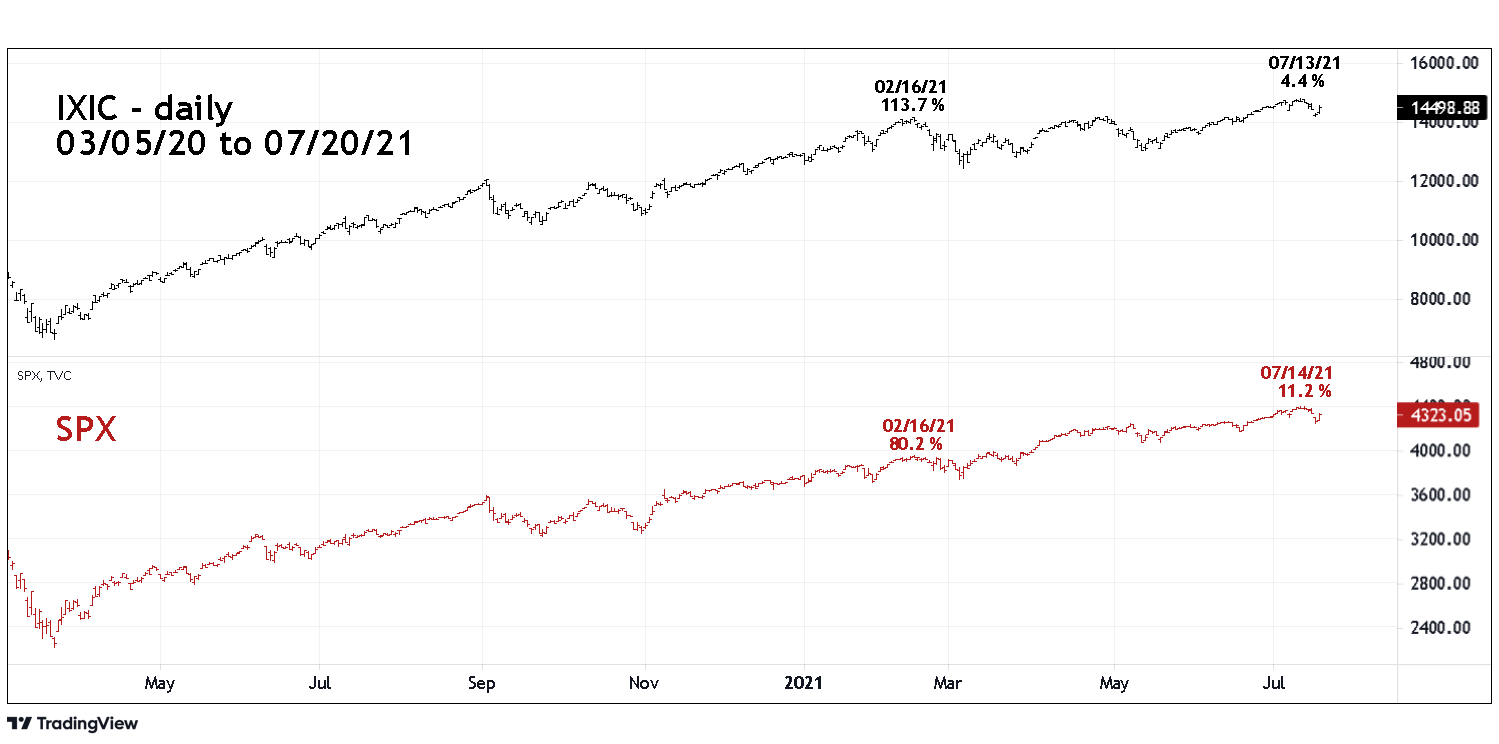
| After March 2020 the Nasdaq Composite (IXIC) had the strongest upside performance of the three main US stock indices. Since February 2021 IXIC has lagged the S&P 500 (SPX) and the Dow Industrial Average. More shockingly the IXIC Advance Decline Line has drastically deteriorated. A bear market in US stocks could soon begin. Nasdaq And S&P 500 Please see the daily IXIC and SPX chart illustrated in Figure 1. From March 2020 to February 2021, IXIC led the way up gaining a spectacular 113.7% vs. the SPX growth of 80.2%. Since February 2021 IXIC has lagged gaining only 4.4% vs. the SPX growth of 11.2%. This may not seem important especially since the Nasdaq overall growth from March 2020 is 123.2% vs. the SPX March 2020 to July 2021 gain of 100.4% but what's happening underneath the surface reveals serious weakness. |
|
| Figure 1. From March 2020 to February 2021 IXIC led the way up gaining a spectacular 113.7%. |
| Graphic provided by: TradingView. |
| |
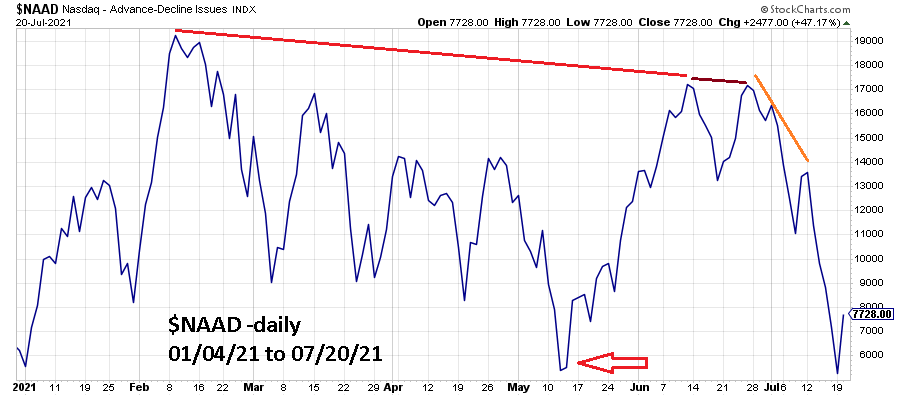
| Nasdaq Composite - Advance/Decline Line Please see the daily Nasdaq Advance-Decline issues ($NAAD) illustrated in Figure 2. $NAAD reached its peak in mid-February 2021 close to the intermediate IXIC February top. There's a divergence vs. the June highs and a small bearish divergence within June. After June 2021, the $NAAD collapsed — a very bearish divergence. Even more shocking, the June 19, 2021, decline brought $NAAD below the level recorded at the May 12, 2021, correction bottom. This implies price could soon be trading at the May 12th bottom, which would be a 12% drop from the IXIC July peak. A case could be made that many stocks within the Nasdaq Composite are already in a bear market. |
|
| Figure 2. After June 2021, the $NAAD collapsed — a very bearish divergence. |
| Graphic provided by: StockCharts.com. |
| |
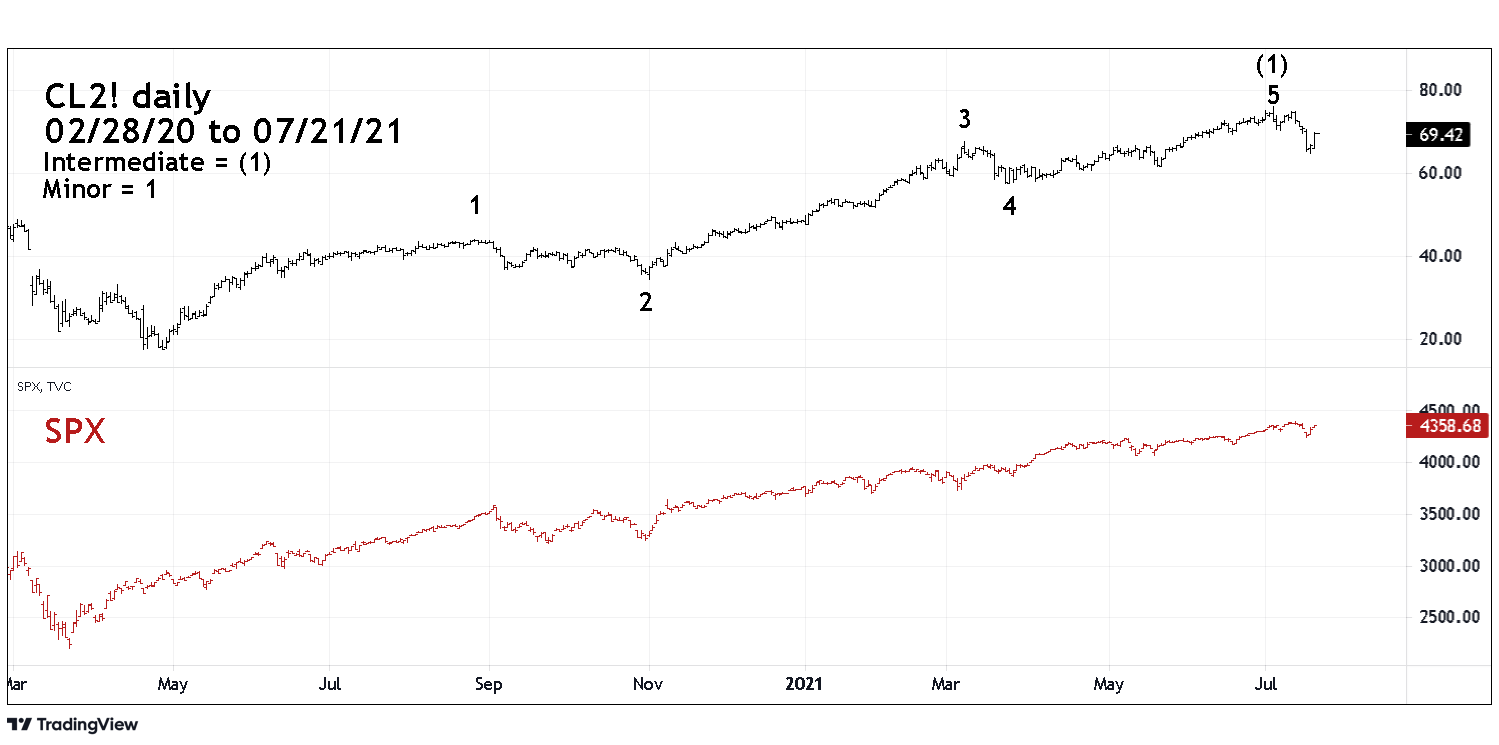
| Crude Oil and S&P 500 My July 15, 2021, article "US Stocks/Crude Oil Connection" noted that since April 2020 the SPX had been in a bull trend with Crude Oil (CL2!). The article focused on CL2! nearing a potential resistance zone, in particular chart resistance at 76.72, noting "The high on July 6, 2021, was 76.07 and could be an important top." Please see the CL2! and SPX chart illustrated in Figure 3. Since July 6 CL2! fell 15% vs. only a 3% SPX decline. It's possible Crude Oil may have completed a five-wave Elliott Impulse pattern from the bottom made in April 2020. If a five-wave impulse is complete it implies a corrective phase proportional to the April 2020 to July 2021 gain has begun. Crude Oil usually has seasonal bottoms in December, and implies a multi-month decline could be underway. |
|
| Figure 3. Crude Oil usually has seasonal bottoms in December, and implies a multi-month decline could be underway. |
| Graphic provided by: TradingView. |
| |
| Economic Forecast Markets tend to move ahead of fundamentals. Major stock market bottoms come before the economy improves. Major tops occur before economies deteriorate. The massive Nasdaq A/D line bearish divergence probably means weakening earnings for many Nasdaq companies. The recent 15% drop in Crude Oil could be a warning of a broader economic contraction. If the SPX breaks below its July 19 bottom and CL2! moves below its July 20 low it could open the door for a significant decline in both markets. Further Reading: Frost A.J and Robert Prechter (1985) "Elliott Wave Principle", New Classics Library. |
Independent investment advisor, trader and writer. He has written articles for Technical Analysis of Stocks & Commodities, Traders.com Advantage,Futuresmag.com and, Finance Magnates. Author of website Four Dimension Trading.
| Website: | www.fourdimensiontrading.com |
| E-mail address: | markrivest@gmail.com |
Click here for more information about our publications!
Comments

Request Information From Our Sponsors
- StockCharts.com, Inc.
- Candle Patterns
- Candlestick Charting Explained
- Intermarket Technical Analysis
- John Murphy on Chart Analysis
- John Murphy's Chart Pattern Recognition
- John Murphy's Market Message
- MurphyExplainsMarketAnalysis-Intermarket Analysis
- MurphyExplainsMarketAnalysis-Visual Analysis
- StockCharts.com
- Technical Analysis of the Financial Markets
- The Visual Investor
- VectorVest, Inc.
- Executive Premier Workshop
- One-Day Options Course
- OptionsPro
- Retirement Income Workshop
- Sure-Fire Trading Systems (VectorVest, Inc.)
- Trading as a Business Workshop
- VectorVest 7 EOD
- VectorVest 7 RealTime/IntraDay
- VectorVest AutoTester
- VectorVest Educational Services
- VectorVest OnLine
- VectorVest Options Analyzer
- VectorVest ProGraphics v6.0
- VectorVest ProTrader 7
- VectorVest RealTime Derby Tool
- VectorVest Simulator
- VectorVest Variator
- VectorVest Watchdog