HOT TOPICS LIST
- MACD
- Fibonacci
- RSI
- Gann
- ADXR
- Stochastics
- Volume
- Triangles
- Futures
- Cycles
- Volatility
- ZIGZAG
- MESA
- Retracement
- Aroon
INDICATORS LIST
LIST OF TOPICS
PRINT THIS ARTICLE
by Mark Rivest
Could the April to May 2021 decline be the start of a larger bear market?
Position: N/A
Mark Rivest
Independent investment advisor, trader and writer. He has written articles for Technical Analysis of Stocks & Commodities, Traders.com Advantage,Futuresmag.com and, Finance Magnates. Author of website Four Dimension Trading.
PRINT THIS ARTICLE
MOMENTUM
Bitcoin Collapse
06/10/21 02:56:55 PMby Mark Rivest
Could the April to May 2021 decline be the start of a larger bear market?
Position: N/A
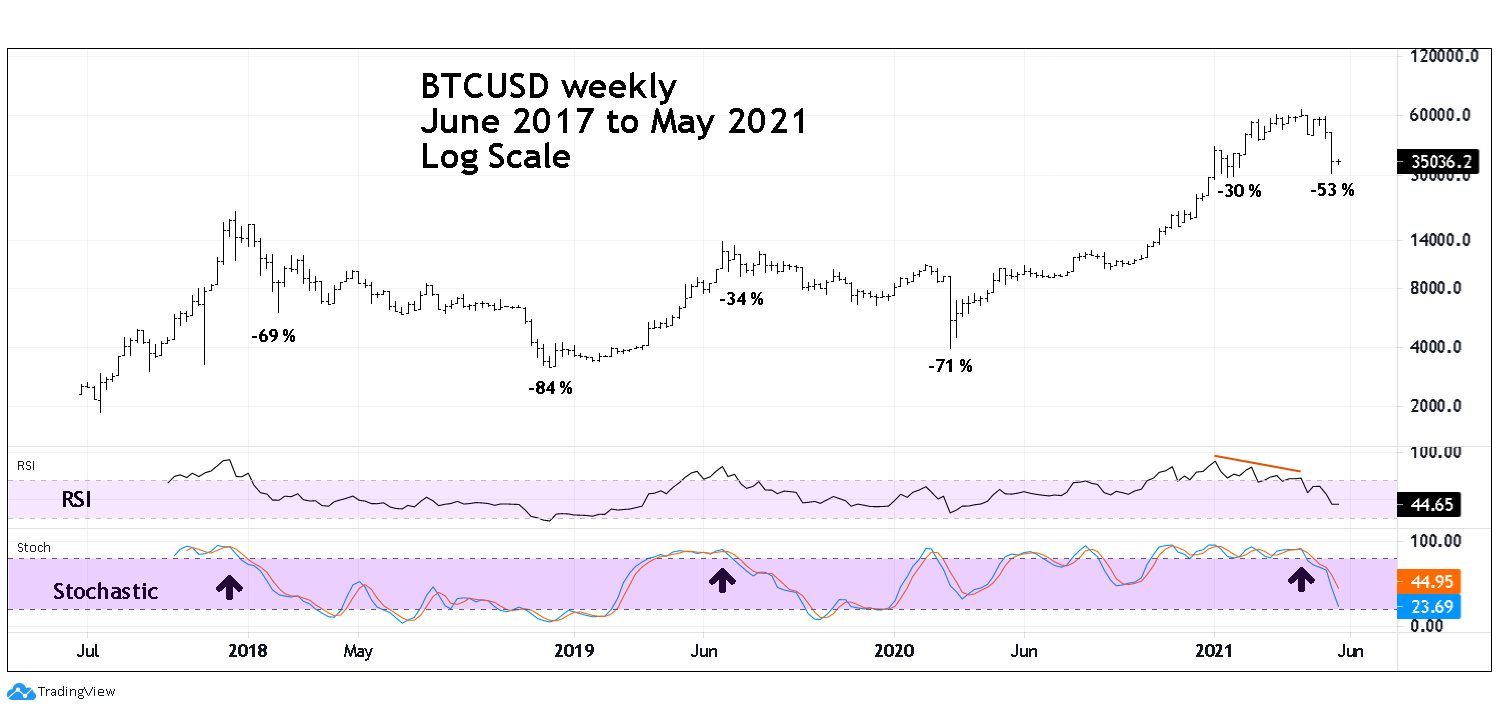
| From March 2020 to April 2021 Bitcoin in US dollars (BTCUSD) gained more than 1500%. To put this in the proper perspective, the Nasdaq 100 (NDX) tech stock mania from October 1998 to March 2000 rose 350%. After the tech stock bubble burst NDX had a two-and-a-half-year bear market declining 83%. If the Bitcoin bubble has burst, it could experience an even faster and deeper drop. Bitcoin Weekly Please see the BTCUSD weekly chart illustrated in Figure 1. This chart shows the history of BTCUSD since its inception in June of 2017. There have been two bear phases, the first began in late 2017. Note the initial decline fell 69% over a period of eight weeks. After a brief bear market rally the drop resumed culminating in a bear market of one year and a loss of 84%. The second bear market began in June 2019 with a three-week 34% drop. The total decline lasted nine months falling 71% The largest correction within the massive 2020 to 2021 bull run was 30%. The April 14, 2021 to May 19, 2021 drop is 53%, much larger than the biggest correction and the first hint that a new bear market could be underway. The next bear market clue comes from the weekly Stochastic. The slow and fast lines have gone deep into the neutral zone, similar to the first phases of the prior two bear markets. Also note the multiple RSI bearish divergences going into the all-time high. That's a signature of an exhausted bull run. As of the week ending May 21 the weekly RSI was still above the over sold zone and implies more downside action. |

|
| Figure 1. As of the week ending May 21 the weekly RSI was still above the over sold zone and implies more downside action. |
| Graphic provided by: TradingView. |
| |
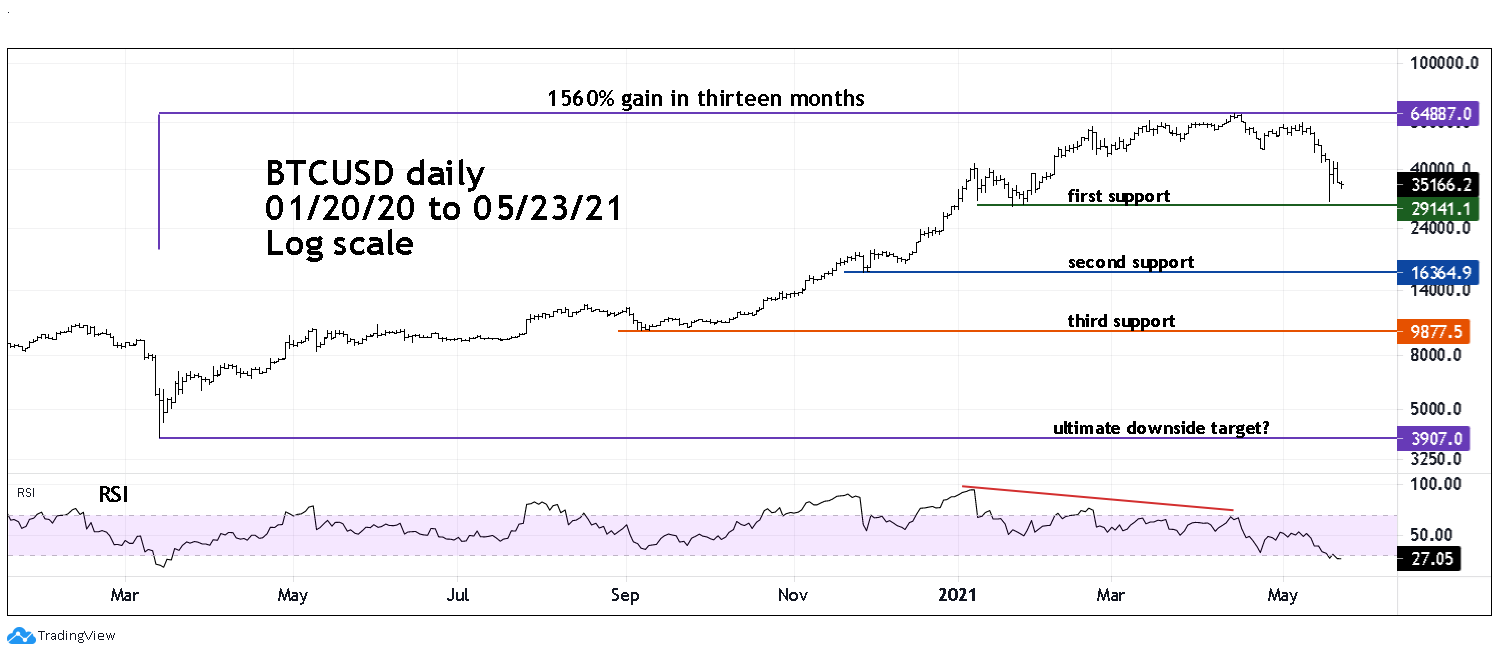
| Bitcoin Daily Please see the BTCUSD daily chart illustrated in Figure 2. This chart focuses on the massive 1500% - 2020 to 2021 rally which is probably one of the most powerful manias in world history. Daily RSI confirms the weakness recorded in the weekly readings. At the May 19 bottom daily RSI has reach the oversold zone and implies at least a bounce may have begun. The May 19 bottom was at an area of significant chart support. If after a short-term rally BTCUSD were to break below the May 19th low, it could set the stage for a very sharp drop. Within Elliott wave theory there's a concept known as "the point of recognition"; this is the point in which the crowd realizes that the market trend has changed. In this situation it would be where the decline is no longer viewed as a correction to buy into but as a bear market to sell. A break of the May 19 bottom could usher in a near vertical drop that quickly brings BTCUSD to the second and perhaps even the third support level. |

|
| Figure 2. A break of the May 19 bottom could usher in a near vertical drop that quickly brings BTCUSD to the second, and perhaps, even the third support level. |
| Graphic provided by: TradingView. |
| |
| Speculative Environment The Bitcoin mania is the most intense part of a larger speculative environment. The US stock market as measured by the S&P 500 (SPX) has from March 2020 to May 2021 rallied 93%. Outside of the Nasdaq tech mania of the late 1990's you have to go back to the mid 1930's to find a more intense bull move. The fourteen-month 93% gain comes after more than a decade long secular bull market. The 2020 to 2021 bull phase is probably the blow off top of the secular bull market. The bursting of the Bitcoin bubble could be a preview of what could happen to the US stock market. My March 4, 2021 article "Bitcoin Relationship to the US Stock Market" noted that several of BTCUSD important turns have corresponded with SPX trend changes. The BTCUSD all-time high was on April 14, 2021. The SPX all-time high was on May 7, 2021, the beginning of a seasonally bearish period that usually continues into October. The Bitcoin collapse as of late May 2021 appears incomplete and could possibly retrace all of the gains made since March 2020. Further Reading: Frost A.J and Robert Prechter (1985) "Elliott Wave Principle", New Classics Library. |
Independent investment advisor, trader and writer. He has written articles for Technical Analysis of Stocks & Commodities, Traders.com Advantage,Futuresmag.com and, Finance Magnates. Author of website Four Dimension Trading.
| Website: | www.fourdimensiontrading.com |
| E-mail address: | markrivest@gmail.com |
Click here for more information about our publications!
PRINT THIS ARTICLE

Request Information From Our Sponsors
- VectorVest, Inc.
- Executive Premier Workshop
- One-Day Options Course
- OptionsPro
- Retirement Income Workshop
- Sure-Fire Trading Systems (VectorVest, Inc.)
- Trading as a Business Workshop
- VectorVest 7 EOD
- VectorVest 7 RealTime/IntraDay
- VectorVest AutoTester
- VectorVest Educational Services
- VectorVest OnLine
- VectorVest Options Analyzer
- VectorVest ProGraphics v6.0
- VectorVest ProTrader 7
- VectorVest RealTime Derby Tool
- VectorVest Simulator
- VectorVest Variator
- VectorVest Watchdog
- StockCharts.com, Inc.
- Candle Patterns
- Candlestick Charting Explained
- Intermarket Technical Analysis
- John Murphy on Chart Analysis
- John Murphy's Chart Pattern Recognition
- John Murphy's Market Message
- MurphyExplainsMarketAnalysis-Intermarket Analysis
- MurphyExplainsMarketAnalysis-Visual Analysis
- StockCharts.com
- Technical Analysis of the Financial Markets
- The Visual Investor
