

HOT TOPICS LIST
- MACD
- Fibonacci
- RSI
- Gann
- ADXR
- Stochastics
- Volume
- Triangles
- Futures
- Cycles
- Volatility
- ZIGZAG
- MESA
- Retracement
- Aroon
INDICATORS LIST
LIST OF TOPICS
PRINT THIS ARTICLE
by Mark Rivest
Both markets could be approaching blowoff tops. Speculative forces can sometimes be so powerful they transcend more than one market. Since March 2020, Bitcoin in US dollars (BTCUSD) and the S&P 500 (SPX) have traded closely together. Evidence in early 2021 indicates their rallies could climax at, or near, the same time.
Position: N/A
Mark Rivest
Independent investment advisor, trader and writer. He has written articles for Technical Analysis of Stocks & Commodities, Traders.com Advantage,Futuresmag.com and, Finance Magnates. Author of website Four Dimension Trading.
PRINT THIS ARTICLE
MOMENTUM
Bitcoin Relationship To The US Stock Market
03/04/21 04:11:38 PMby Mark Rivest
Both markets could be approaching blowoff tops. Speculative forces can sometimes be so powerful they transcend more than one market. Since March 2020, Bitcoin in US dollars (BTCUSD) and the S&P 500 (SPX) have traded closely together. Evidence in early 2021 indicates their rallies could climax at, or near, the same time.
Position: N/A
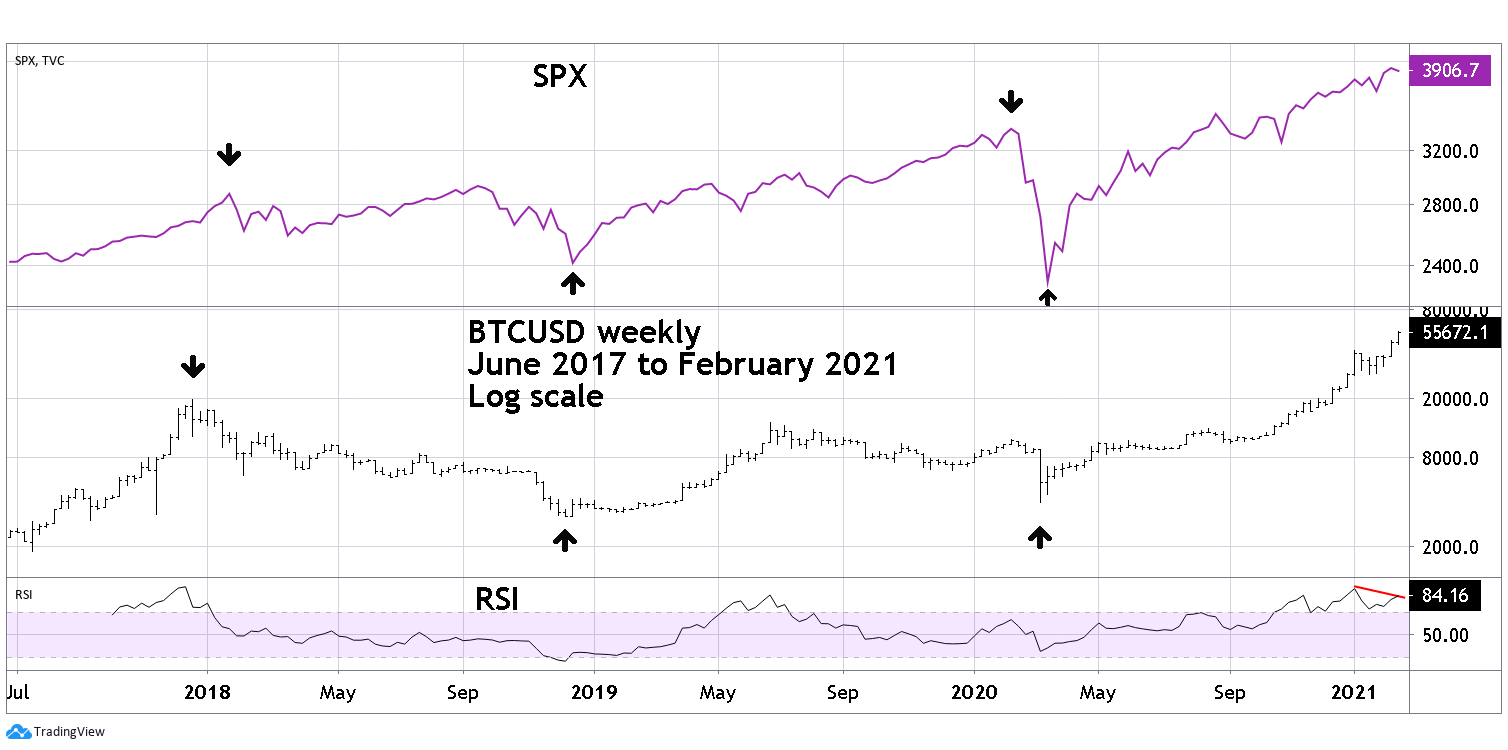
| Bitcoin Weekly Please see the weekly BTCUSD and SPX chart illustrated in Figure 1. Since BTCUSD began trading in June of 2017 several of its important turns have corresponded with SPX trend changes. In December 2017 BTCUSD's first important top came about a month and a half before the SPX climaxed a powerful up move. The December 2017 peak marked the beginning of a yearlong BTCUSD bear market. The nadir of the down move occurred about a week before the SPX completed a correction. After the next bull move BTCUSD made a secondary top about simultaneously with the SPX. Then both markets crashed February to March 2020. BTCUSD bottomed about a week and a half before the SPX. BTCUSD's secondary bottom was made on March 23, while the SPX made a new crash low hinted the panic was abating. As of mid-February 2021, both markets are making new highs together. While on February 19 the SPX was slightly below its all-time high made on February 16, the Dow Jones Industrial average was making a new all-time high. Note BTCUSD weekly RSI has a bearish divergence hinting a down move could be coming soon. |
|
| Figure 1. Since BTCUSD began trading in June of 2017 several of its important turns have corresponded with SPX trend changes. |
| Graphic provided by: TradingView. |
| |
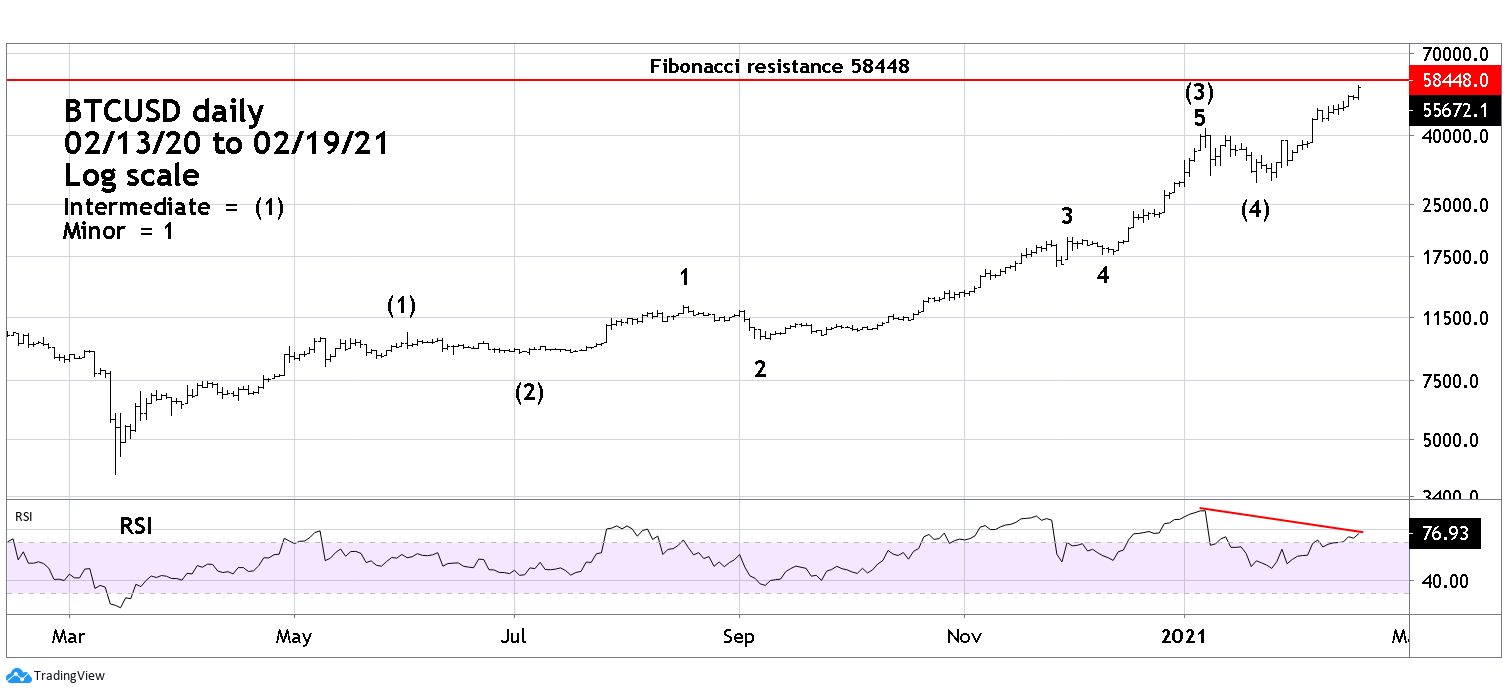
| Bitcoin Daily Please see the BTCUSD chart illustrated in Figure 2. Since the March 2020 bottom, BTCUSD has rallied in what appears to be an extended five-wave Elliott impulse pattern. In an extended impulse one of the three motives waves also subdivide into a five-wave pattern. Extensions are usually the longest in time and make the most price progress. Extensions can occur in any of the three motive waves. In this case it's the third wave labeled Intermediate (3). Within Elliott wave motive patterns there's usually a Fibonacci relationship between waves "one" and "five". The most common relationship is equality in price and occasionally in time. The next most likely Fibonacci relationship is the .618 ratio. Because BTCUSD's large percentage gain from March 2020 to February 2021 it's better to compare growth rates rather than points. A move in BTCUSD from 4500 to 5000 is not the same as a move from 40000 to 40500. The supposed Intermediate wave (1) went from 3907 to 10414, a growth rate of 1.665. Multiplying 1.665 by .618 equals 1.029. Adding this growth rate to the supposed Intermediate wave (4) of 28807 targets BTCUSD 58448 for Intermediate wave (5). The high on February 19 was 56343. Note the daily RSI has a significant bearish divergence similar to the weekly RSI. |
|
| Figure 2. Since the March 2020 bottom BTCUSD has rallied in what appears to be an extended five�wave Elliott impulse pattern. |
| Graphic provided by: TradingView. |
| |
| Dual Market Climax As of mid-February 2021 both BTCUSD and SPX were exhibiting signs of potentially significant peaks. My February 18 article "Buying A Stairway To Heaven" noted the SPX was nearing what could be important Fibonacci resistance at SPX 4008. On February 16 SPX high was 3950. SPX daily RSI has a bearish divergence as does the weekly RSI. If BTCUSD peaks first, the SPX could continue making new highs into late April which has long been a seasonal topping time zone for US stocks. With both markets in proximity to potential important resistance, simultaneous peaks are possible. If both markets make important tops in early 2021, the subsequent drops could be in the range of 30 to 40%. The time frame may only be a few months. Buying BTCUSD and SPX declines since March 2020 has been a successful strategy. Later in 2021 buying BTCUSD and SPX could produce significant losses. Further Reading: Frost A.J and Robert Prechter (1985) "Elliott Wave Principle", New Classics Library. |
Independent investment advisor, trader and writer. He has written articles for Technical Analysis of Stocks & Commodities, Traders.com Advantage,Futuresmag.com and, Finance Magnates. Author of website Four Dimension Trading.
| Website: | www.fourdimensiontrading.com |
| E-mail address: | markrivest@gmail.com |
Click here for more information about our publications!
PRINT THIS ARTICLE

Request Information From Our Sponsors
- StockCharts.com, Inc.
- Candle Patterns
- Candlestick Charting Explained
- Intermarket Technical Analysis
- John Murphy on Chart Analysis
- John Murphy's Chart Pattern Recognition
- John Murphy's Market Message
- MurphyExplainsMarketAnalysis-Intermarket Analysis
- MurphyExplainsMarketAnalysis-Visual Analysis
- StockCharts.com
- Technical Analysis of the Financial Markets
- The Visual Investor
- VectorVest, Inc.
- Executive Premier Workshop
- One-Day Options Course
- OptionsPro
- Retirement Income Workshop
- Sure-Fire Trading Systems (VectorVest, Inc.)
- Trading as a Business Workshop
- VectorVest 7 EOD
- VectorVest 7 RealTime/IntraDay
- VectorVest AutoTester
- VectorVest Educational Services
- VectorVest OnLine
- VectorVest Options Analyzer
- VectorVest ProGraphics v6.0
- VectorVest ProTrader 7
- VectorVest RealTime Derby Tool
- VectorVest Simulator
- VectorVest Variator
- VectorVest Watchdog