

HOT TOPICS LIST
- MACD
- Fibonacci
- RSI
- Gann
- ADXR
- Stochastics
- Volume
- Triangles
- Futures
- Cycles
- Volatility
- ZIGZAG
- MESA
- Retracement
- Aroon
INDICATORS LIST
LIST OF TOPICS
PRINT THIS ARTICLE
by Mark Rivest
Incredible mania of the US stock market.
Position: N/A
Mark Rivest
Independent investment advisor, trader and writer. He has written articles for Technical Analysis of Stocks & Commodities, Traders.com Advantage,Futuresmag.com and, Finance Magnates. Author of website Four Dimension Trading.
PRINT THIS ARTICLE
MOMENTUM
Buying A Stairway To Heaven
02/18/21 04:28:37 PMby Mark Rivest
Incredible mania of the US stock market.
Position: N/A
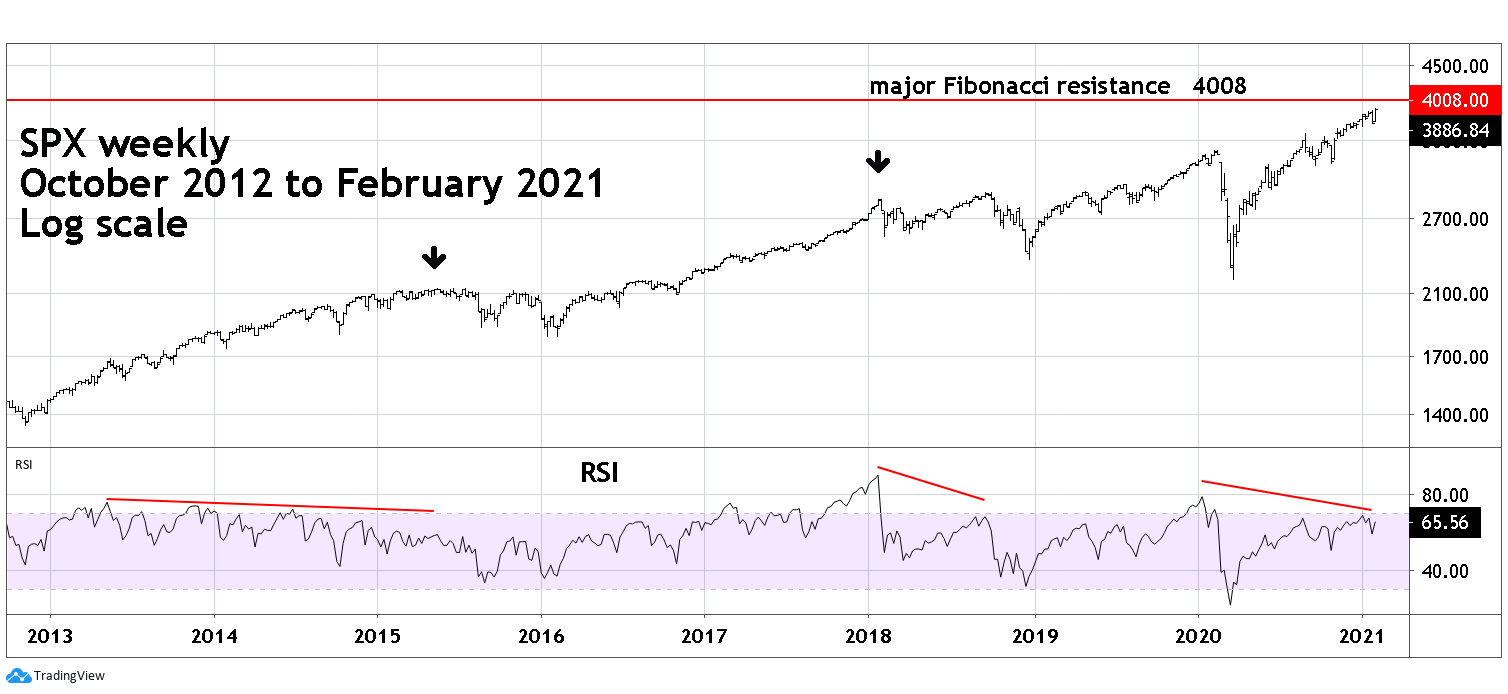
| Prior to the S&P 500 (SPX) rally that began in March 2020, the most powerful bull move of the last twelve years was the climb up from the March 2009 major bottom. That rally lasted until April 2010 — 286 trading days — and gained 82.9%. As of February 5, 2021 the SPX had gained 77.6% since its March 23, 2020 bottom — 221 trading days. If you want to find a more powerful bull run, look at the Dow Jones Industrial Average in the mid 1930's. In early 2021 it's a good time for stock bulls, how long can it last? S&P 500 Weekly Please see the SPX weekly chart illustrated in Figure 1. The weekly RSI gives a perspective on the topping process for stock indices. RSI for stocks almost always requires at least one bearish divergence before a significant top can be in place. The steady rally from 2012 to 2015 represents the central portion of the secular bull market that began in March 2009. In Elliott wave terms this bull phase is a third of a third wave which are usually long and steady. With this type of action it's expected to prolong the RSI divergence process which took nearly two-years. The topping process in 2018 was more typical, lasting nine months before experiencing a significant decline. The current divergence process is so far about one-year. The current rally's angle of assent is much greater than the 2013 to 2015 rise; it's doubtful the current divergent could continue for two years. If the weekly RSI divergence continues a price peak could come in a few months or sooner. The SPX Fibonacci resistance at 4008 is derived from taking the SPX 2009 to 2010 rally growth of 82.9% and adding it to the SPX March 23, 2020 bottom at 2191. |
|
| Figure 1. The weekly RSI gives a perspective on the topping process for stock indices. |
| Graphic provided by: TradingView. |
| |
| S&P 500 Bullish Percent Index The Bullish Percent Index is a breadth indicator based on the number of stocks on Point & Figure Buy Signals within an index. The S&P 500 Bullish Percent Index ($BPSPX) gives a good view of what's happening underneath the surface. In late January 2021, the SPX had a brief 4.5% drop yet look what happened to $BPSPX. It retraced more than two-thirds of its progress after the important October 30,2020 bottom. This indicates a large number of downside stock breaks within the SPX. If the divergence continues it implies an important SPX peak could be just a few weeks away. |

|
| Figure 2. The S&P 500 Bullish Percent Index gives a good view of what�s happening underneath the surface. |
| Graphic provided by: StockCharts.com. |
| |
| NYSE New 52-Week Highs New highs on the NYSE confirms the bearish message from $BPSPX. If the current bearish divergence holds, a double or even a triple bearish divergence of new highs could develop in the coming weeks. |

|
| Figure 3. New highs on the NYSE confirms the bearish message from $BPSPX. |
| Graphic provided by: StockCharts.com. |
| |
| Spike Top? The broader move up since the crash bottom in March 2020 is a price spike. What's happened in early 2021 could be considered a spike on top of a spike. Just prior to the SPX peak on January 26, 2021 there was abundant bearish evidence, detailed on my website. What materialized was a tiny 4.5% drop. While very near-term, in early to mid-February there could be another decline, we need to be prepared for the SPX to continue its rapid climb. If so, an important SPX peak could be made by March 2021 somewhere in the low 4000 area. In early 2021 stock bulls think they are headed towards heaven, later in the year they may find themselves in a different location. Further Reading: Neill B. Humphrey (1985) "The Art of Contrary Thinking" The Caxton Printers. |
Independent investment advisor, trader and writer. He has written articles for Technical Analysis of Stocks & Commodities, Traders.com Advantage,Futuresmag.com and, Finance Magnates. Author of website Four Dimension Trading.
| Website: | www.fourdimensiontrading.com |
| E-mail address: | markrivest@gmail.com |
Click here for more information about our publications!
Comments
Date:�02/19/21Rank:�5Comment:�This is simpler to understand than most Mark s complex articles, with all the intricate Fibonacci relationships

Request Information From Our Sponsors
- VectorVest, Inc.
- Executive Premier Workshop
- One-Day Options Course
- OptionsPro
- Retirement Income Workshop
- Sure-Fire Trading Systems (VectorVest, Inc.)
- Trading as a Business Workshop
- VectorVest 7 EOD
- VectorVest 7 RealTime/IntraDay
- VectorVest AutoTester
- VectorVest Educational Services
- VectorVest OnLine
- VectorVest Options Analyzer
- VectorVest ProGraphics v6.0
- VectorVest ProTrader 7
- VectorVest RealTime Derby Tool
- VectorVest Simulator
- VectorVest Variator
- VectorVest Watchdog
- StockCharts.com, Inc.
- Candle Patterns
- Candlestick Charting Explained
- Intermarket Technical Analysis
- John Murphy on Chart Analysis
- John Murphy's Chart Pattern Recognition
- John Murphy's Market Message
- MurphyExplainsMarketAnalysis-Intermarket Analysis
- MurphyExplainsMarketAnalysis-Visual Analysis
- StockCharts.com
- Technical Analysis of the Financial Markets
- The Visual Investor