HOT TOPICS LIST
- MACD
- Fibonacci
- RSI
- Gann
- ADXR
- Stochastics
- Volume
- Triangles
- Futures
- Cycles
- Volatility
- ZIGZAG
- MESA
- Retracement
- Aroon
INDICATORS LIST
LIST OF TOPICS
PRINT THIS ARTICLE
by Matt Blackman
Inflation is alive and well, and gold is responding
Position: N/A
Matt Blackman
Matt Blackman is a full-time technical and financial writer and trader. He produces corporate and financial newsletters, and assists clients in getting published in the mainstream media. Matt has earned the Chartered Market Technician (CMT) designation. Follow Matt on Twitter at www.twitter.com/RatioTrade
PRINT THIS ARTICLE
BREAKOUTS
Gold Stocks On The Move
06/10/21 02:48:43 PMby Matt Blackman
Inflation is alive and well, and gold is responding
Position: N/A
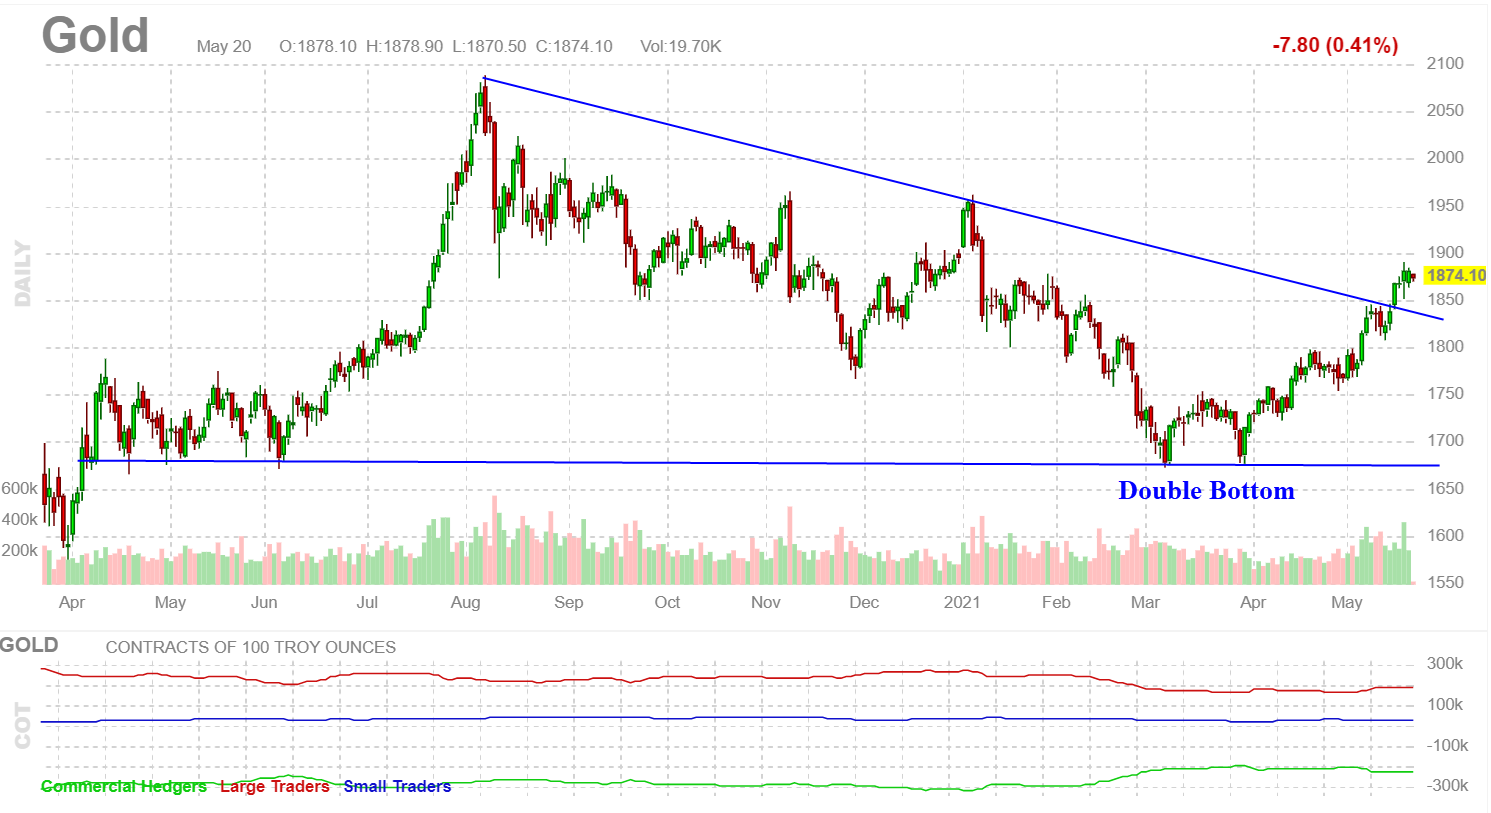
| You'd hardly know that we are in a pandemic from the way stocks, real property, lumber and a host of other assets have been responding. Trillions have been added to our money supply in the last 14 months. M2 money supply (money in circulation plus a group of financial assets plus savings deposits, small denomination deposits and balances of retail money market mutual funds) jumped nearly $3 trillion between February and July 2020 (see "Cranking Up the Money Tree"). This Fed reaction has certainly had the desired effect. The price of gold was no exception. As we see from Figure 1, after briefly dropping below $1,500/oz in late March 2020, the gold futures took off soaring nearly 40%, hitting $2,089 in early August before reversing direction back below $1,700 by March 2021 as inflation fears abated. As we see in this first chart, gold futures posted a classic double bottom chart pattern in March with medium-term support at $1680 and began rallying again. It decisively broke above symmetrical triangle top line resistance on above average volume May 17. A consolidation in the form of a bull flag or pennant pattern from that point would be bullish. |

|
| Figure 1. Daily chart of gold futures from April 2020 showing the big jump then protracted decline before forming a new base around $1,680 followed by a symmetrical triangle breakout May 17. |
| Graphic provided by: https://finviz.com/. |
| |
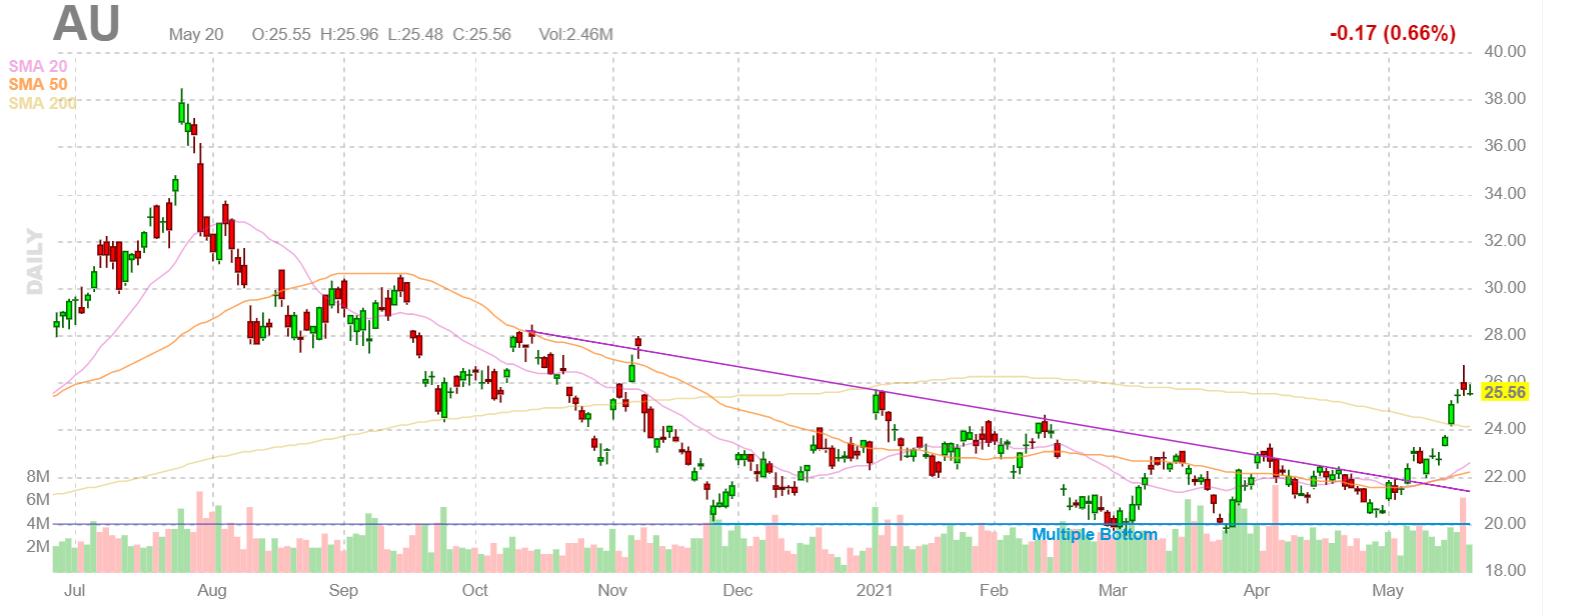
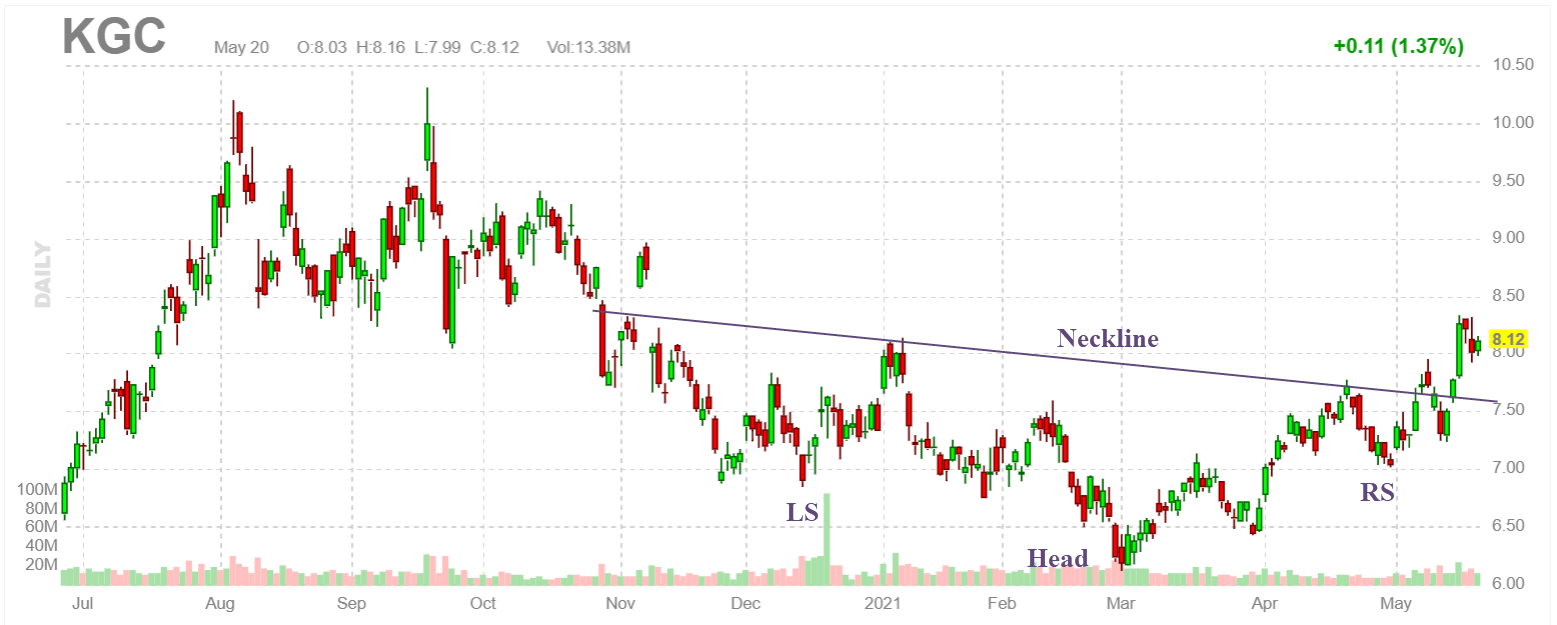
| As we see in Figure 2, the last year has been tough on gold producers. AngloGold Ashanti Ltd saw its stock price nearly cut in half between late July 2020 and March 2021. But it too has broken out from its symmetrical triangle pattern. More important from a technical perspective — the stock posted a bullish multiple bottom chart pattern in the process confirming the $20 area as strong support, before launching a new rally. And it's not alone. Long time goldminer, Kinross Gold posted a bullish inverse Head and Shoulders pattern between October 2020 and early May 2021 before breaking above the down-sloping neckline in the first week of May on bullish buying volume (see Figure 4). |

|
| Figure 2. Daily chart of AngloGold Ashanti showing the bullish triangle and multiple bottom chart pattern that formed between October 2020 and May 2021. |
| Graphic provided by: https://finviz.com/. |
| |
| But as we see in Figure 3, AngloGold and Kinross also share some interesting fundamentals. Both have P/Es under 20, positive Forward P/Es, positive past 5-year growth rates, positive Returns on Investment (ROIs) and positive Gross and Operating Margins as well as positive expected Earnings per Share (EPS) growth next year. |

|
| Figure 3. Table outline the bullish fundamentals for a handful of gold stocks including AngloGold and Kinross (see red ellipse). |
| Graphic provided by: https://finviz.com/. |
| |
| In an ideal investment world, technicals and fundamentals should work together to help you find the best trading candidates. However, as traders quickly learn, that is not often the case. But when it does, it pays to take notice. As always, it also pays to employ a written trading plan with pre-arranged stop losses and profit targets. And when picture-perfect chart patterns distressingly reverse direction, it is often a signal to slip out of long pants and put on your shorts. |

|
| Figure 4. Daily chart of Kinross Gold showing the bullish inverse chart pattern that also formed between October 2020 and May 2021. |
| Graphic provided by: https://finviz.com/. |
| |
| Suggested Reading: Bubblenomics - A Textbook Example? What Is Driving Stock Prices Into The Stratosphere? Cranking Up The Money Tree |
Matt Blackman is a full-time technical and financial writer and trader. He produces corporate and financial newsletters, and assists clients in getting published in the mainstream media. Matt has earned the Chartered Market Technician (CMT) designation. Follow Matt on Twitter at www.twitter.com/RatioTrade
| Title: | Author |
| Company: | TradeSystemGuru |
| Address: | Box 2589 |
| Garibaldi Highlands, BC V0N1T0 | |
| Phone # for sales: | 6048989069 |
| E-mail address: | indextradermb@gmail.com |
Traders' Resource Links | |
| TradeSystemGuru has not added any product or service information to TRADERS' RESOURCE. | |
Click here for more information about our publications!
Comments

|

Request Information From Our Sponsors
- StockCharts.com, Inc.
- Candle Patterns
- Candlestick Charting Explained
- Intermarket Technical Analysis
- John Murphy on Chart Analysis
- John Murphy's Chart Pattern Recognition
- John Murphy's Market Message
- MurphyExplainsMarketAnalysis-Intermarket Analysis
- MurphyExplainsMarketAnalysis-Visual Analysis
- StockCharts.com
- Technical Analysis of the Financial Markets
- The Visual Investor
- VectorVest, Inc.
- Executive Premier Workshop
- One-Day Options Course
- OptionsPro
- Retirement Income Workshop
- Sure-Fire Trading Systems (VectorVest, Inc.)
- Trading as a Business Workshop
- VectorVest 7 EOD
- VectorVest 7 RealTime/IntraDay
- VectorVest AutoTester
- VectorVest Educational Services
- VectorVest OnLine
- VectorVest Options Analyzer
- VectorVest ProGraphics v6.0
- VectorVest ProTrader 7
- VectorVest RealTime Derby Tool
- VectorVest Simulator
- VectorVest Variator
- VectorVest Watchdog
