HOT TOPICS LIST
- MACD
- Fibonacci
- RSI
- Gann
- ADXR
- Stochastics
- Volume
- Triangles
- Futures
- Cycles
- Volatility
- ZIGZAG
- MESA
- Retracement
- Aroon
INDICATORS LIST
LIST OF TOPICS
PRINT THIS ARTICLE
by Mark Rivest
Early April 2021 rally in US stocks could be a blow off top.
Position: N/A
Mark Rivest
Independent investment advisor, trader and writer. He has written articles for Technical Analysis of Stocks & Commodities, Traders.com Advantage,Futuresmag.com and, Finance Magnates. Author of website Four Dimension Trading.
PRINT THIS ARTICLE
ELLIOTT WAVE
End of the Road? - Part Two
04/30/21 04:09:40 PMby Mark Rivest
Early April 2021 rally in US stocks could be a blow off top.
Position: N/A
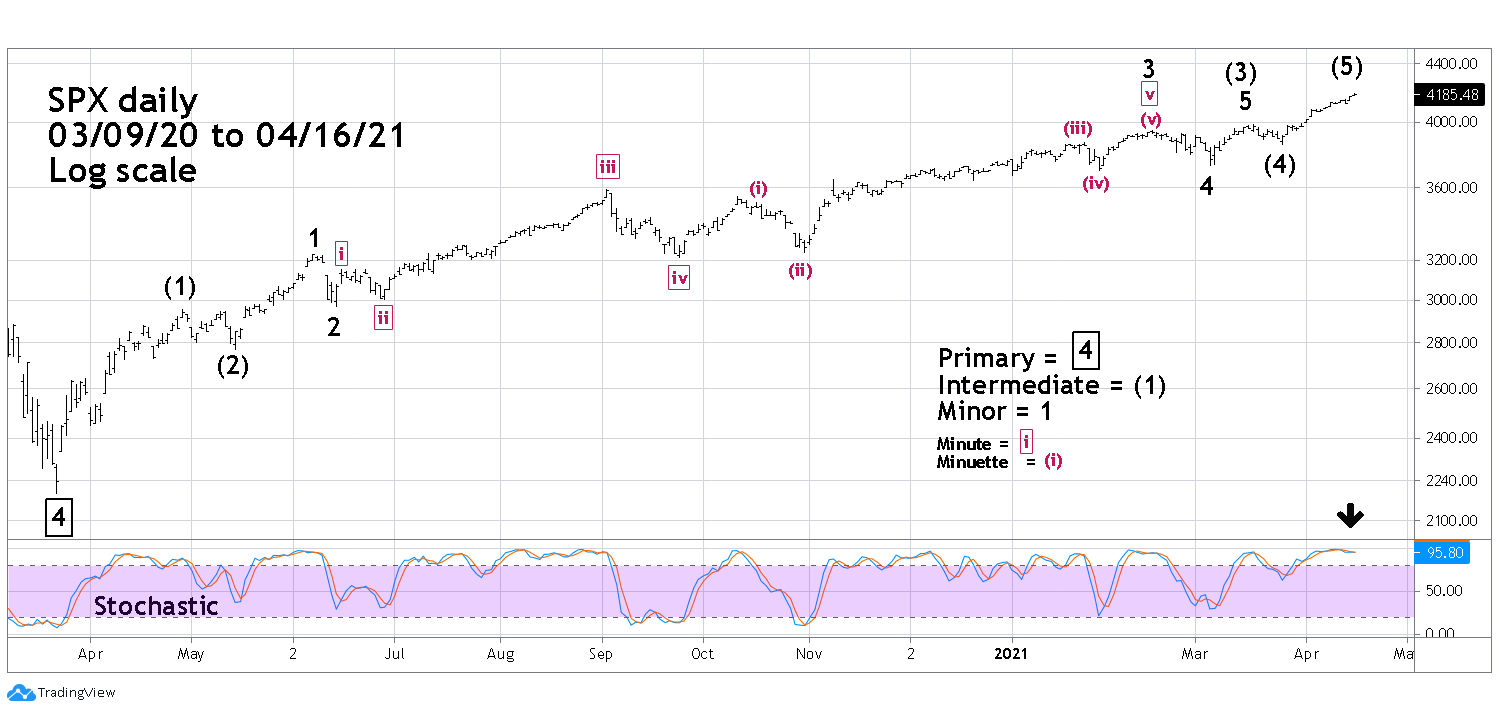
| As of April 16, 2021 the S&P 500 (SPX) had risen an incredible 91.2% from the March 2020 bottom. This is further and faster than even the powerful March 2009 to April 2010 rally of 82.9%. The current thirteen-month bull move could be called a blow off top to the entire secular bull market that began in March 2009. Even more fascinating, the spike up from March 25, 2021 to mid-April could be a blow off of the bull move since March 2020. S&P 500 Please see the daily SPX chart illustrated in Figure 1. This is a revised Elliott wave count to the SPX chart illustrated in my April 1, 2021 article "End of the Road?" which speculated that an Elliott wave Ending Diagonal Triangle (EDT) was forming after the January 29, 2021 bottom. The powerful rally blasted far above the supposed EDT'S upper trend line invalidating that wave count. It now appears the entire structure from the March 23, 2020 bottom is an extended Elliott impulse pattern. Note there's also an extension within the extension which began at the September 2020 bottom and continued into the February 2021 peak. Stochastic is a sensitive momentum indicator and is usually the first to detect possible trend changes. On April 14 Stochastic had a bearish crossover. At the close of the April 16 session with the SPX at a higher price the %K line (blue) was still below the %D line (orange). This hints a decline could come soon. |

|
| Figure 1. Stochastic is a sensitive momentum indicator and is usually the first to detect possible trend changes. |
| Graphic provided by: TradingView. |
| |
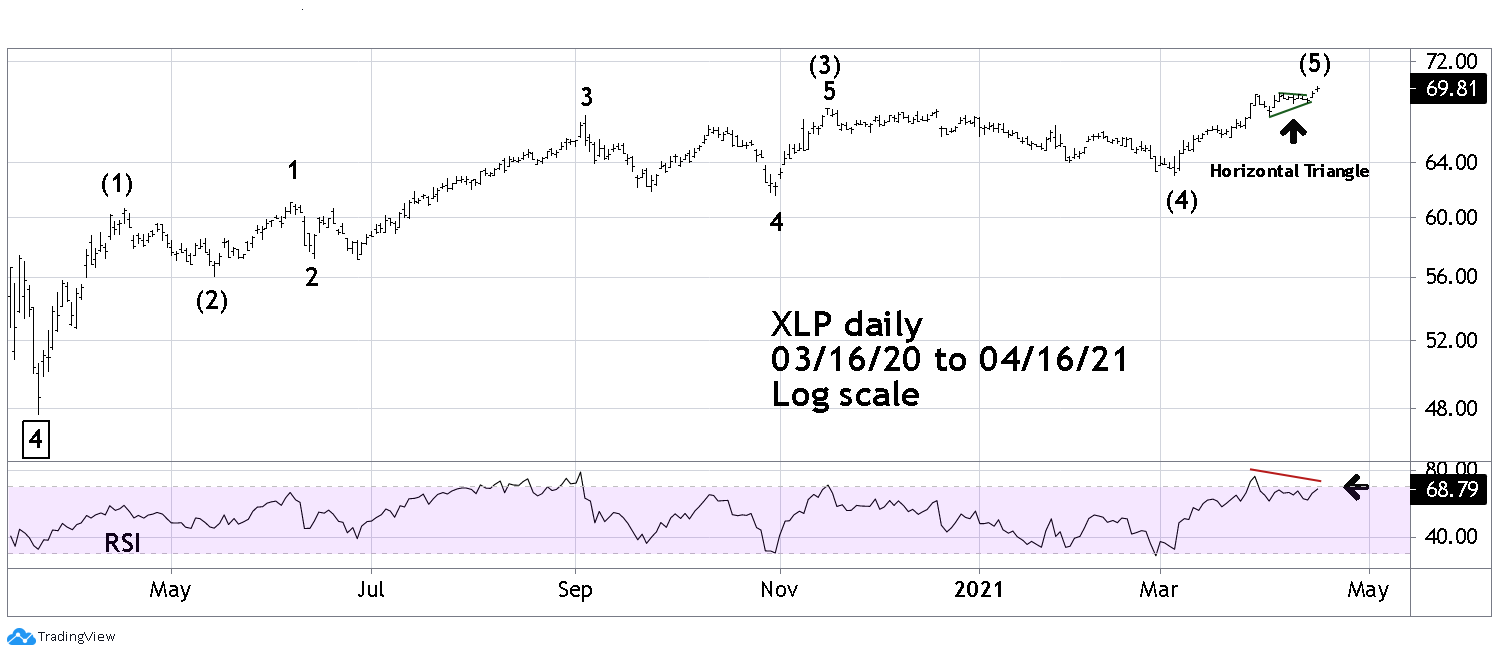
| Consumer Staple Sector Confirmation of an Elliott wave count for a stock index can be found on other stock indices or individual stocks. Please see the Consumer Staples Sector SPDR Exchange Traded Fund (XLP) illustrated in Figure 2. XLP shows a clear Elliott extended impulse from the March 2020 bottom. Note the possible Horizontal Triangle that formed from March 29 to April 14. This structure only appears in the fourth wave position of motive waves. In this case its minor wave "4" of Intermediate wave (5). After completion of a Horizontal Triangle there's usually a thrust in the direction of the primary trend, which in this case is up. The thrust up was underway on April 16. Note the bearish RSI divergence as XLP moved to a new high. |

|
| Figure 2. XLP shows a clear Elliott extended impulse from the March 2020 bottom. |
| Graphic provided by: TradingView. |
| |
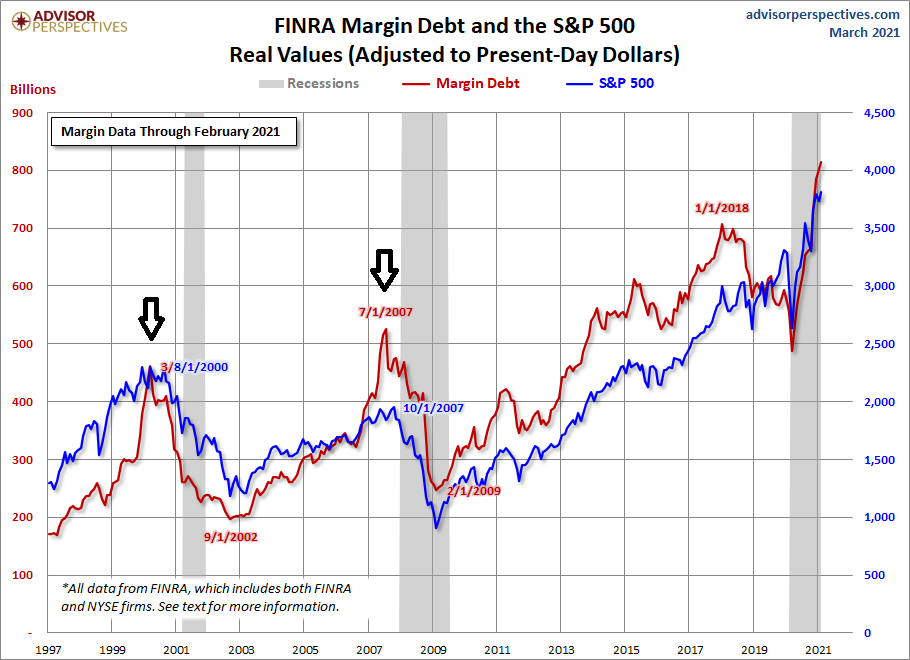
| Sentiment At significant stock market tops bullish sentiment usually reaches an extreme level. Please see the FINRA Margin Debt and S&P 500 chart illustrated in Figure 3. Note this chart shows the SPX adjusted to present dollars. The SPX peak made in 2007 on an unadjusted chart was above the top made in 2000. Margin debt as of February 2021 was at an all-time high and far above the levels achieved during the SPX tops made in 2000 and 2007. Also, in early April, data from Bank of America revealed that the fund inflows to stock oriented mutual funds and ETFs since November 2020 was $569 Billion. The total inflows from March 2009 to 2020 was $452 billion. In five months, more money went into stocks than in the prior eleven years! This is staggering and represents incredible complacency in regard to stock market risk. |

|
| Figure 3. Margin debt as of February 2021 was at an all-time high. |
| Graphic provided by: Advisor Perspectives. |
| |
| Blow Off Tops Rapid bull market terminations usually occur in commodities and individual stocks. They're rare for stock indices. The last SPX blow off top occurred late 2017 to early 2018. The rally that commenced December 29, 2017 lasted 18 trading days rising 7.4%. The current rally since March 25 to April 16 gained 8.7% in 15 trading days. The recent rally has moved faster and farther than the early 2018 spike. After the January 2018 rally the SPX had a micro crash falling more than 11% in only nine trading days. Could another micro crash happen in 2021? US stocks are seasonally bearish from late April to October. With the rally going into the second half of April and excessive bullish sentiment, there's a good chance for a sudden reversal in late April/early May 2021. Further Reading: Frost A.J and Robert Prechter (1985) "Elliott Wave Principle", New Classics Library. |
Independent investment advisor, trader and writer. He has written articles for Technical Analysis of Stocks & Commodities, Traders.com Advantage,Futuresmag.com and, Finance Magnates. Author of website Four Dimension Trading.
| Website: | www.fourdimensiontrading.com |
| E-mail address: | markrivest@gmail.com |
Click here for more information about our publications!
PRINT THIS ARTICLE

Request Information From Our Sponsors
- StockCharts.com, Inc.
- Candle Patterns
- Candlestick Charting Explained
- Intermarket Technical Analysis
- John Murphy on Chart Analysis
- John Murphy's Chart Pattern Recognition
- John Murphy's Market Message
- MurphyExplainsMarketAnalysis-Intermarket Analysis
- MurphyExplainsMarketAnalysis-Visual Analysis
- StockCharts.com
- Technical Analysis of the Financial Markets
- The Visual Investor
- VectorVest, Inc.
- Executive Premier Workshop
- One-Day Options Course
- OptionsPro
- Retirement Income Workshop
- Sure-Fire Trading Systems (VectorVest, Inc.)
- Trading as a Business Workshop
- VectorVest 7 EOD
- VectorVest 7 RealTime/IntraDay
- VectorVest AutoTester
- VectorVest Educational Services
- VectorVest OnLine
- VectorVest Options Analyzer
- VectorVest ProGraphics v6.0
- VectorVest ProTrader 7
- VectorVest RealTime Derby Tool
- VectorVest Simulator
- VectorVest Variator
- VectorVest Watchdog
