

HOT TOPICS LIST
- MACD
- Fibonacci
- RSI
- Gann
- ADXR
- Stochastics
- Volume
- Triangles
- Futures
- Cycles
- Volatility
- ZIGZAG
- MESA
- Retracement
- Aroon
INDICATORS LIST
LIST OF TOPICS
PRINT THIS ARTICLE
by Mark Rivest
Elliott wave pattern could be signaling termination of the stock bull market.
Position: N/A
Mark Rivest
Independent investment advisor, trader and writer. He has written articles for Technical Analysis of Stocks & Commodities, Traders.com Advantage,Futuresmag.com and, Finance Magnates. Author of website Four Dimension Trading.
PRINT THIS ARTICLE
ELLIOTT WAVE
End of the Road?
04/01/21 02:25:14 PMby Mark Rivest
Elliott wave pattern could be signaling termination of the stock bull market.
Position: N/A
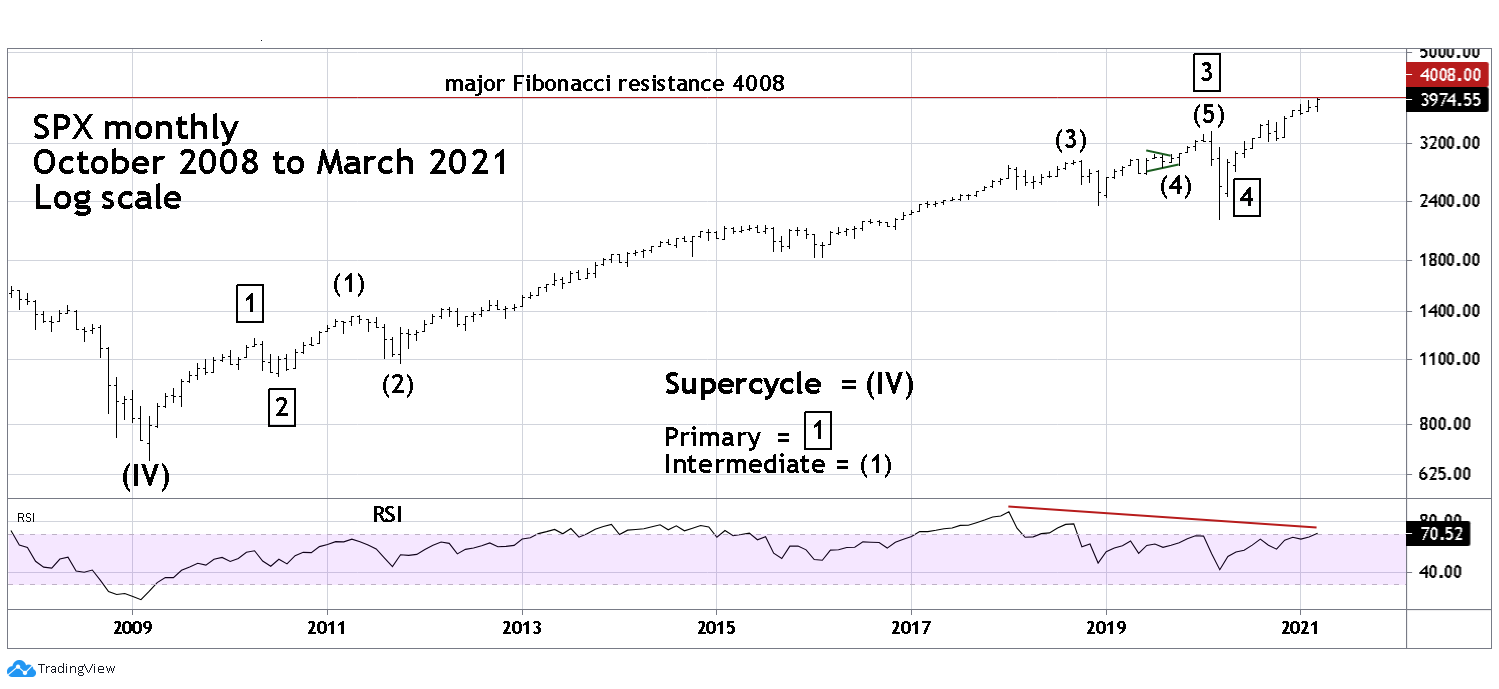
| Since March 2020, the US stock market has been in the most powerful bull market since the mid 1930's. With the global economy recovering from the Coronavirus and a massive stimulus program in the US it appears the rally could continue for months. Long and short-term momentum indicators combined with a particular Elliott wave pattern suggests a significant decline could soon begin. Long-term Pattern Please see the monthly S&P 500 (SPX) chart illustrated in Figure 1. The SPX rise after the major bottom in March 2009 looks like a classic Elliott five-wave impulse pattern. Note the first two years have what is referred to as a series of "ones" and "twos" up — Primary wave "1" boxed and Intermediate wave (1). This combination is the prelude to a long and steady bull move, which is what happened. The final two years of the twelve-year structure is choppy. This is referred to as a series of "fours" and "fives" — the prelude to completion of the entire twelve-year secular bull market. Note the monthly RSI has a significant bearish divergence vs. the SPX momentum peak made in September 2018. Usually there's a Fibonacci relationship between waves "one" and "five" of an Elliott impulse pattern. The growth rate of Primary wave "1", the bull move from March 2009 to April 2010, was 82.9%. Adding this growth rate to the March 2020 bottom targets SPX 4008 as a possible termination point for Primary wave "5". |
|
| Figure 1. The SPX rise after the major bottom in March 2009 looks like a classic Elliott five-wave impulse pattern. |
| Graphic provided by: TradingView. |
| |
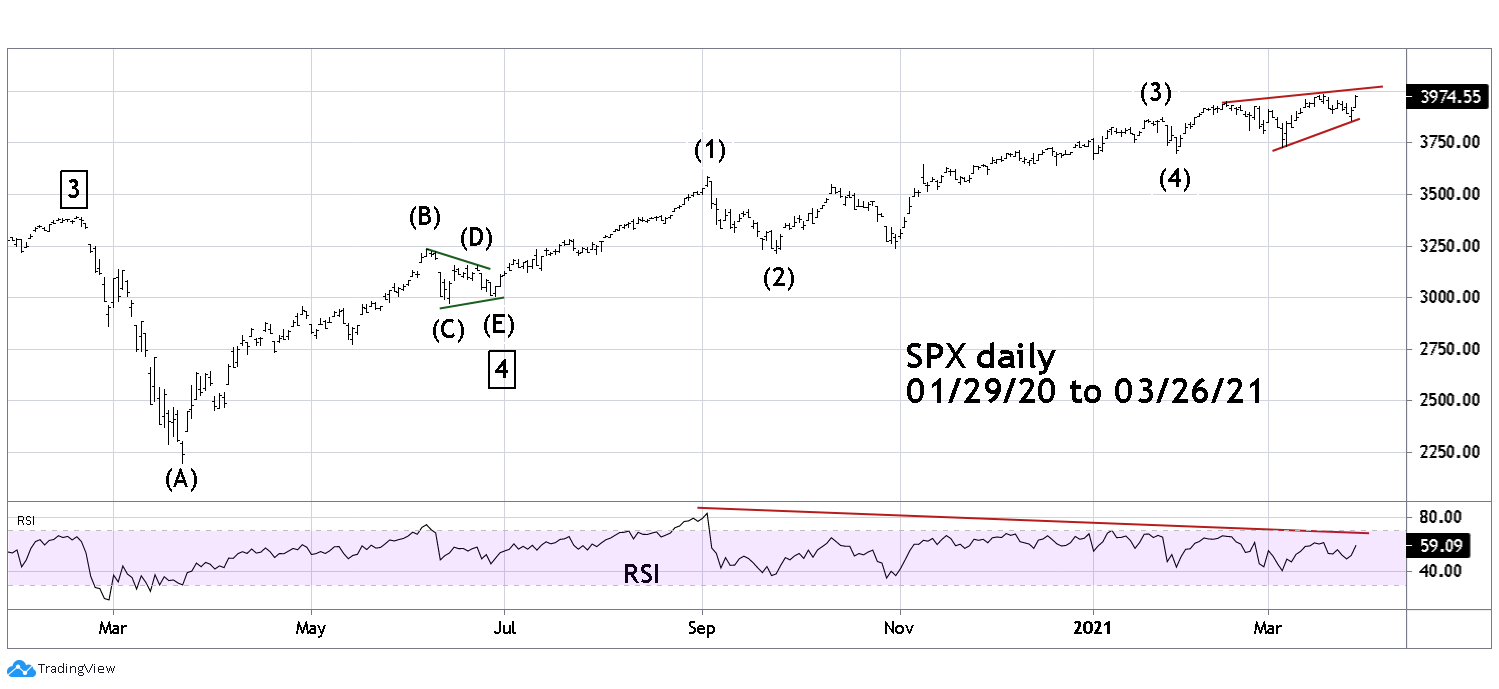
| Mid-term Pattern Please see the daily SPX chart from January 2020 to March 2021 illustrated in Figure 2. My article in the March 2021 issue of Technical Analysis of Stocks & Commodities, "Elliott Wave Perspective For US Stocks, 2009-2020" illustrated that an Elliott wave Horizontal Triangle pattern may have completed at the SPX October 30, 2020 bottom. Subsequent wave action has invalidated that count. The best wave count to explain the SPX rise since the March 23, 2020 bottom has a Horizontal Triangle ending at the June 29, 2020 bottom. The reason for not originally choosing this date for the end of the Horizontal Triangle is that the September to October correction was proportionally more logical. When deciding the best wave count, proportionality is usually a good guideline, not a rule — there are exceptions. The daily SPX RSI has the same message as the monthly RSI — a significant weakening of momentum. |
|
| Figure 2. The daily SPX RSI has the same message as the monthly RSI — a significant weakening of momentum. |
| Graphic provided by: TradingView. |
| |
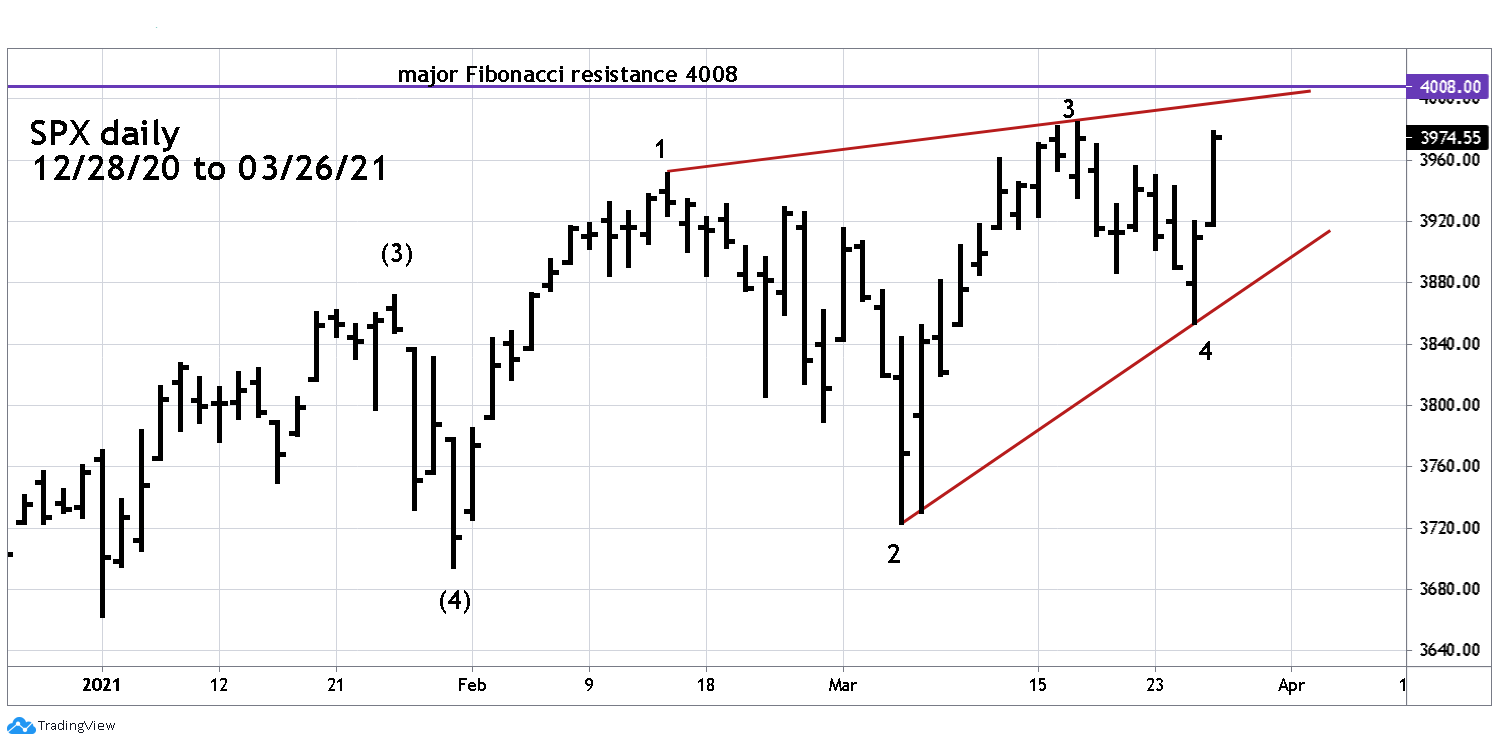
| Short-term Pattern Please see the daily December 2020 to March 2021 SPX chart illustrated in Figure 3. Since the January 29, 2021 bottom the SPX appears to be forming an Elliott wave Ending Diagonal Triangle (EDT). This is a termination pattern that forms in the fifth wave position of motive patterns and in wave "C" of corrective pattens. Wave "fours" of an EDT almost always cross over into the price territory of wave "one", which in this case has happened. EDT's form a diagonal wedge and frequently terminate with a marginal trust beyond the trend line connecting the termination points of waves "one" and "three". If the short-term rally that began on March 25 continues there could be a break beyond the trend line on March 29, 2021. The ideal scenario is the SPX rally terminating near major Fibonacci resistance at 4008. EDT trendline breaks are fast; on this scale if the SPX is still above the trendline even one day after the break, it would be a clue that something more bullish could be developing. |
|
| Figure 3. Since the January 29, 2021 bottom the SPX appears to be forming an Elliott wave Ending Diagonal Triangle. |
| Graphic provided by: TradingView. |
| |
| Summary Bearish price patterns with weakening momentum nearing potential major resistance is the recipe for what could be a significant decline. The evidence presented in this article of a potential major top in US stocks is just the tip of the iceberg. Additional evidence can be viewed in my Traders.com Advantage articles since the beginning of 2021 and at my website. If the analysis in this article is correct, at the very least the US stock market could be on the verge of a multi-month correction. If the long-term Elliott wave pattern since March 2009 is completing, the US and global stock market could be entering a multi-year bear phase. Further Reading: Frost A.J and Robert Prechter (1985) "Elliott Wave Principle", New Classics Library. Rivest, Mark (2021) "Elliott Wave Perspective For US Stocks, 2009-2020" Technical Analysis of Stocks & Commodities, Volume 39: March issue. |
Independent investment advisor, trader and writer. He has written articles for Technical Analysis of Stocks & Commodities, Traders.com Advantage,Futuresmag.com and, Finance Magnates. Author of website Four Dimension Trading.
| Website: | www.fourdimensiontrading.com |
| E-mail address: | markrivest@gmail.com |
Click here for more information about our publications!
PRINT THIS ARTICLE

Request Information From Our Sponsors
- StockCharts.com, Inc.
- Candle Patterns
- Candlestick Charting Explained
- Intermarket Technical Analysis
- John Murphy on Chart Analysis
- John Murphy's Chart Pattern Recognition
- John Murphy's Market Message
- MurphyExplainsMarketAnalysis-Intermarket Analysis
- MurphyExplainsMarketAnalysis-Visual Analysis
- StockCharts.com
- Technical Analysis of the Financial Markets
- The Visual Investor
- VectorVest, Inc.
- Executive Premier Workshop
- One-Day Options Course
- OptionsPro
- Retirement Income Workshop
- Sure-Fire Trading Systems (VectorVest, Inc.)
- Trading as a Business Workshop
- VectorVest 7 EOD
- VectorVest 7 RealTime/IntraDay
- VectorVest AutoTester
- VectorVest Educational Services
- VectorVest OnLine
- VectorVest Options Analyzer
- VectorVest ProGraphics v6.0
- VectorVest ProTrader 7
- VectorVest RealTime Derby Tool
- VectorVest Simulator
- VectorVest Variator
- VectorVest Watchdog